
Miami Ranks Seventh in Housing Shortage Report As Florida Sees Nations Highest Rent Increase Since 2020
New research has shown that Miami ranks seventh in housing shortage report as Florida has seen the highest rent increase in the nation since 2020. Prices have continued to push higher where rental rates a 2 bedroom rental on Miami Beach is up over 46% year-over-year as of June 2023. Developers have struggled to keep pace despite Miami-developers leading the nation with a record 28,000 units currently under development in the Miami metro-area.
New research has shown that Miami ranks seventh in housing shortage report as Florida has seen the highest rent increase in the nation since 2020. Prices have continued to push higher where rental rates a 2 bedroom rental on Miami Beach is up over 46% year-over-year as of June 2023. Developers have struggled to keep pace despite Miami-developers leading the nation with a record 28,000 units currently under development in the Miami metro-area according to a Costar report.
New research has revealed the top 10 metropolitan areas with the highest ratio of house shortages in accordance with job growth. Miami, FL, is facing a significant challenge in its housing market, as indicated by its job growth-to-building permits ratio of 20.2.
The other US metropolitan areas experiencing housing shortages include San Francisco, Springfield, Urban Honolulu, Syracuse, Boston, New York City, Chicago, New Haven, and Los Angeles.
Real estate site PortlandRealEstate.com analyzed data from the National Association of Realtors, US Census Bureau, and the Bureau of Labor Statistics, examining new job openings per one building permit to determine the housing shortages in metropolitan areas in 2022.
Job Growth-to-Building Permits Ratio: 1. New York City, NY (31.4); 2. San Francisco, CA (29.2); 3. Springfield, MA (26.6); 4. Urban Honolulu, HI (25.1); 5. Syracuse, NY (21.8); 6. Boston, MA (20.4); 7. Miami, FL (20.2); 8. Chicago, IL (19.5); 9. New Haven, CT (19.3); 10. Los Angeles, CA (18.3)
The job growth-to-building permits ratio represents the relationship between new job opportunities created and new building permits issued. Specifically, it indicates the number of new jobs generated for every building permit issued. For example, a ratio of 30 means that, on average, approximately 30 new jobs were created for each new building permit issued. For reference, the average job growth-to-building permits ratio for cities included in the study was 7.64.
Miami, FL, faces a housing shortage as reflected by its job growth-to-building permits ratio of 20.2. The ratio suggests that the job market in the area is experiencing growth, potentially outpacing the construction of new housing units. As a result, the limited housing supply leads to increased housing costs and affordability challenges for residents.
“Miami is seeing rapid job growth as companies and employers move to the city for its pro-business environment and high-quality of life. This has led to a higher housing shortage than most other metro-areas as developers have struggled to keep up, leading to high-prices and rapid rent growth. Units in Downtown Miami and Brickell that would have rented for $2,000 or $3,000 a few years ago are now renting for potentially $5,000+. The residents moving out have not yet found comparable replacements yet more people are moving to the city so developers are pushing to keep pace as pricing pushes higher on average.” Said Demetri Demascus, Co-Founder of PROFILEmiami, Managing Broker of ALTARA Properties and developer of Casa Azzura townhomes in Coconut Grove.
Due to the demand for business to move to the Sunshine State, Florida rent prices are up by 45.77% since 2020, the highest in the nation according to a study by Los Angeles-based luxury real estate experts Los Feliz. Florida and Colorado have seen rent prices increase by over 45% since 2020. With 34.2% of the U.S population renting their home, luxury real estate experts at Los Feliz analyzed the average rental price in each state in March 2020 and again in March 2023 to calculate the percentage increase by comparing average rental price in each state in March 2020 and again in March 2023 to calculate the percentage increase. 34.2% of the U.S population rents their home.
The findings show that Florida’s average rent has increased to $2,127.86 in 2023, an increase of 45.77% over the 2020 price. Florida has low taxes, a thriving job market and fast growing metropolitan cities. Florida is also known for its high percentage of retirees that are drawn to the state due to there being no retirement taxes and sunshine state is also a popular holiday destination which would affect rental prices.
According to Zumper, as of June 2023, the current median rent for a 2-bedroom apartment in Miami is $3,900, a 32% year-over-year change. Taverage rent for a 1-bedroom apartment in Miami, FL is $2,835. This is a 29% increase compared to the previous year. The current median rent for a 2-bedroom apartment in Miami Beach as of June 2023 is $4,500, an 46% year-over-year change. The current average rent for a 1-bedroom apartment in Miami Beach is $2,600, an 18% increase compared to the previous year.
This article contains information from the following sources and studies:
Study conducted by PortlandRealEstate.com, a real estate website that specializes in providing comprehensive information and analysis related to the Portland real estate market.
A study conducted by Los Feliz, a Los Angeles-based luxury real estate brokerage with Ruby Home using Zillow: https://www.rubyhome.com/los-angeles/los-feliz/
Douglas Elliman Releases Q2 2020 South Florida Market Reports
Douglas Elliman has just released their Q2 2020 Market Reports for South Florida, which were prepared by Miller Samuel, a leading independent appraisal firm. The reports, which cover the areas such as Boca Raton, Delray Beach, Fort Lauderdale, Miami Beach, and the Miami Coastal Mainland, have revealed that the COVID-19 market shutdown during much of the second quarter caused sales to fall sharply in South Florida.
Douglas Elliman has just released their Q2 2020 Market Reports for South Florida, which were prepared by Miller Samuel, a leading independent appraisal firm. The reports, which cover the areas such as Boca Raton, Delray Beach, Fort Lauderdale, Miami Beach, and the Miami Coastal Mainland, have revealed that the COVID-19 market shutdown during much of the second quarter caused sales to fall sharply in South Florida, despite the strength of the market in the first quarter.
Miami Beach/Barrier Islands
Overview:
Condo price trend indicators moved higher as the number of sales dropped during the shutdown
Single-family price trend indicators continued to decline along with sales and listing inventory year over year
Luxury condo price trend indicators pressed higher as listing inventory showed a slight gain
Key Trend Metrics (Year to Year)
Overall:
Median sales price rose 10.3% to $480,000
Average price per square foot edged up 6.1% to $659
Number of sales dropped 34.9% to 501
Listing inventory decreased by 0.5% to 6,393 units
Luxury Condo:
Median sales price increased by 11.6% to $2,850,000
Average price per square foot rose 4.8% to $1,231
Number of sales fell 37.7% to 43
Listing inventory slipped 3.0% to 1,095 units
Luxury Single Family:
Median sales price decreased by 22.6% to $7,200,000
Average price per square foot jumped 17.2% to $1,388
Number of sales had no change at 9
Listing inventory increased by 25.4% to 173 units
Miami Coastal Mainland
Overview:
Condo listing inventory and number of sales declined, median sales price reached a new record
Single-family median sales price rose to a new record as both sales and listing inventory fell sharply
Luxury condo price trend indicators showed mixed results as the number of sales saw a significant decline
Key Trend Metrics (Year to Year)
Overall:
Median sales price rose 4.4% to $355,000
Average price per square foot increased by 5.1% to $289
Number of sales dropped 20.1% to 2,672
Listing inventory declined by 7.8% to 9,699 units
Luxury Condo:
Median sales price fell 14.0% to $805,000
Average price per square foot dropped 0.6% to $489
Number of sales declined by 33.5% to 115
Listing inventory increased by 13.4% to 2,508 units
Luxury Single Family:
Median sales price fell 11.9% to $1,410,000
Average price per square foot rose 25.5% to $557
Number of sales decreased by 6.1% to 153
Listing inventory dropped 1.1% to 915 units
Fort Lauderdale
Overview:
Condo sales dropped at the highest rate in more than thirteen years as all price trend indicators rose annually
Single-family sales fell at the largest rate since 2007 as median sales price stabilized
Luxury condo price trend indicators increased above year-ago levels at their most robust rate in six quarters
Key Trend Metrics (Year to Year)
Luxury Condo:
Median sales price rose 6.0% to $1,282,330
Average price per square foot increased by 5.2% to $587
Number of sales slipped 27.5% to 37
Listing inventory declined by 16.5% to 283 units
Luxury Single Family:
Median sales price dropped 22.5% to $2,500,000
Average price per square foot decreased by 23.9% to $596
Number of sales fell 20.5% to 35
Listing inventory declined by 12.5% to 259 units
Boca Raton/Highland Beach
Overall:
Condo sales declined year over year at its highest rate in 13 years as median sales price increased
Single-family sales declined year over year at its highest rate in 13 years as median sales price surged
Luxury condo median sales price declined while luxury single-family median sales price rose
Key Trend Metrics (Year to Year)
Luxury Condo:
Median sales price fell 23.0% to $885,000
Average price per square foot slipped 13.0% to $461
Number of sales declined by 21.2% to 52
Listing inventory surged 11.2% to 328
Luxury Single Family:
Median sales price dropped 13.1% to $2,215,000
Average price per square foot decreased by 12.6% to $382
Number of sales slipped 12.1% to 51
Listing inventory declined by 0.3% to 304 units
Delray Beach
Overview:
Single-family sales declined at the largest year over year rate in over thirteen years as the market paused
Condo median sales price was unchanged year over year, the eighteenth straight quarter without a decline
Luxury single-family listing inventory declined annually as luxury condo listing inventory saw a large gain
Key Trend Metrics (Year to Year)
Luxury Condo:
Median sales price decreased by 6.7% to $810,500
Average price per square foot rose 6.7% to $445
Number of sales slipped 24.6% to 46
Listing inventory surged 20.9% to 208 units
Luxury Single Family:
Median sales price dropped 0.6% to $2,087,500
Average price per square foot fell 13.7% to $504
Number of sales declined by 15.2% to 28
Listing inventory increased by 5.7% to 130
Wellington
Overview:
Condo sales declined sharply as median sales price increased year over year for the fifteenth straight quarter
Single-family listing inventory and sales showed sharp declines from prior year levels
Luxury listing inventory across both property types jumped from prior year
Key Trend Metrics (Year to Year)
Luxury Condo:
Median sales price fell 19.9% to $585,000
Average price per square foot dropped 10.1% to $313
Number of sales increased by 16.7% to 7
Listing inventory rose 72.2% to 62 units
Luxury Single Family:
Median sales price declined 24.3% to $1,135,000
Average price per square foot slipped 34.9% to $426
Number of sales jumped 15.0% to 23
Listing inventory increased by 9.2% to 226 units
Palm Beach
Overview:
Condo price trend indicators jumped as the largest average sales size in two years skewed them higher
Single-family listing inventory fell by the largest rate in seven years of tracking
Luxury listing inventory showed a substantial drop as price trend indicators surged year over year
Key Trend Metrics (Year to Year)
Luxury Condo and Single Family:
Median sales price surged 33.1% to $14,000,000
Average price per square foot rose 18.4% to $2,180
Number of sales dropped 30.8% to 9
Listing inventory declined by 65.6% to 22 units
Jupiter/Palm Beach Gardens
Jupiter Overview:
Single-family sales price trend indicators and sales continued to show substantial year over year growth
Condo price trend indicators rose year over year for the fourth straight quarter
Palm Beach Gardens Overview:
Single-family sales fell at their most significant rate in fourteen years
Condo price trend indicators rose year over year for the third consecutive quarter
Key Trend Metrics (Year to Year)
Jupiter Luxury Condo:
Median sales price decreased by 19.9% to $733,000
Average price per square foot dropped 10.6% to $404
Number of sales fell 13.6% to 19
Listing inventory increased by 16.7% to 63 units
Jupiter Luxury Single Family:
Median sales price declined by 11.5% to $2,300,000
Average price per square foot decreased by 2.9% to $647
Number of sales fell 7.4% to 25
Listing inventory dropped 15.3% to 111 units
Palm Beach Gardens Luxury Condo:
Median sales price fell 26.7% to $440,000
Average price per square foot dropped 24.1% to $239
Number of sales declined by 19.0% to 17
Listing inventory surged 67.4% to 72 units
Palm Beach Gardens Luxury Single Family:
Median sales price jumped 21.2% to $2,347,500
Average price per square foot rose 8.7% to $501
Number of sales decreased by 23.1% to 20
Listing inventory dropped 27.5% to 95 units
By Isabella Zimmermann
Douglas Elliman Releases June 2020 New Signed Contracts Report for Florida
Douglas Elliman in conjunction with Miller Samuel, a leading independent appraisal firm, has released its second monthly recurring report for June 2020. The report focuses on the new contracts signed and new listings that entered the rapidly changing market in Douglas Elliman’s Florida regions of Miami-Dade, Broward, Palm Beach, Pinellas, and Hillsborough.
Douglas Elliman in conjunction with Miller Samuel, a leading independent appraisal firm, has released its second monthly recurring report for June 2020. The report focuses on the new contracts signed and new listings that entered the rapidly changing market in Douglas Elliman’s Florida regions of Miami-Dade, Broward, Palm Beach, Pinellas, and Hillsborough. Overall, there was a surge in new signed contracts far exceeding year-ago levels, with excess demand coming from the Northeast. However, new inventory level gains have not kept pace with the growth in new contracts.
New contracts and new listings for each property type have been broken out by eight price tranches depending on regional pricing, on a year to year basis. Douglas Elliman will release a similar report to this one once again during the first week of August to disclose data regarding the number of new contracts signed and new listings during the month of July.
Palm Beach County
Key Trend Metrics (Year to Year)
Single Family:
Number of new signed contracts soared 71.3% to 4,261 contracts
Listing inventory dropped 19.9% to 1,604 units
642 single family homes priced above $1M went into contract, a 114.7% increase from last year
Condo:
Number of new signed contracts jumped 76.0% to 2,626 contracts
Listing inventory surged 4.2% to 1,175 units
Condos priced between $200K and $299K saw a 107.6% incline in the number of signed contracts for a total of 467
Broward County
Key Trend Metrics (Year to Year)
Single Family:
Number of new signed contracts rose 76.1% to 4,336 contracts
Listing inventory decreased by 27.0% to 1,622 units
There was a 123.2% increase in the number of signed contracts for homes priced between $600K and $799K
Condo:
Number of new signed contracts surged 61.4% to 3,154 contracts
Listing inventory fell 14.2% to 1,403 units
78 condos priced between $500K and $599K went into contract, a 116.7% jump from last year
Miami-Dade County
Key Trend Metrics (Year to Year)
Single Family:
Number of new signed contracts edged up 74.3% to 3,955 contracts
Listing inventory dropped 25.0% to 1,426 units
There were 172 homes priced between $800K and $99K that went into contract, a 123.4% increase from last year for similarly priced homes
Condo:
Number of new signed contracts climbed 54.6% to 4,093 contracts
Listing inventory slipped 4.0% to 1,918 units
643 condos priced between $200K and $299K went into contract compared to last year’s 344
Pinellas County
Key Trend Metrics (Year to Year)
Single Family:
Number of new signed contracts surged 95.9% to 2,897 contracts
Listing inventory decreased by 26.9% to 1,031 units
There was a 148.8% rise in homes priced between $500K and $599K that went into contract
Condo:
Number of new signed contracts increased by 93.4% to 1,408 contracts
Listing inventory fell 12.0% to 512 units
28 condos priced between $800K and $999K went into contract, a 250.0% surge from last year’s 8
Hillsborough County
Key Trend Metrics (Year to Year)
Single Family:
Number of new signed contracts rose 98.2% to 4,524 contracts
Listing inventory declined 32.1% to 1,550 units
There was a 223.9% jump in the number of new signed contracts for homes priced at or above $1M
Condo:
Number of new signed contracts grew 124.0% to 616 contracts
Listing inventory declined 18.9% to 223 units
Condos priced at or above $1M saw a drastic increase of 1633.3% in the number of new signed contracts for a total of 52
by Isabella Zimmermann
Douglas Elliman Releases Q1 2019 Market Reports For South Florida
Douglas Elliman released their Q1 2019 Market Reports in South Florida.The South Florida Market reports showed price trends generally edging higher, although sales slipped and inventory slightly increased this quarter. The markets included Miami Beach and Barrier Islands,Fort Lauderdale , Boca Raton, Highland Beach, Delray Beach, Wellington, Palm Beach, Jupiter, and Palm Beach Gardens.
Douglas Elliman released their Q1 2019 Market Reports in South Florida.The South Florida Market reports showed price trends generally edging higher, although sales slipped and inventory slightly increased this quarter. The markets included Miami Beach and Barrier Islands,Fort Lauderdale , Boca Raton, Highland Beach, Delray Beach, Wellington, Palm Beach, Jupiter, and Palm Beach Gardens.
Miami Beach/Barrier Islands
Overview:
Overall price trend indicators increased than year ago levels
Marketing time jumped as older inventory was sold
Condo median sales price remained unchanged
All single family price trend indicators increased as sales decreased
Luxury condo inventory slipped
Luxury single family price trend indicators surged
Key Trend Metrics(Year to Year):
Overall:
Median sales price rose 2.3% to $440,000
Average sales price increased 11.6% to $1,129,317
Number of sales slipped 2% to 772
Days on market was 145, up from 80
Listing discount was 10.6%, up from 10.4%
Listing inventory slipped 0.3% to 6,726
Luxury Condo:
Median sales price rose 12.7% to $3,225,000
Average price per square foot decreased 11% to $1,299
Days on market was 70, down from 72
Listing discount was 12.7%, up from 11.5%
Listing inventory declined 6.6% to 1,006 units
Entry threshold began at $1,864,000, up from 1,750,000
Luxury Single Family:
Median sales price surged 61% to $10,100,000
Average price per square foot rose 2.6% to $1,524
Days on market was 352 up from 141
Listing discount was 12.1%, down from 17.9%
Listing inventory fell 38.5% to 152 units
Entry threshold began at $7,250,000, up 70.6%
Miami Coastal Mainland
Overview:
Median sales price rose year over year for the eighteenth consecutive quarter
Sales declined annually for the first time in three quarters
Listing inventory trended higher for the fourth straight quarter
Luxury condo listing inventory declined annually for the fourth consecutive quarter
Luxury condo price trend indicators were mixed year over year as marketing time expanded
Luxury single family price trend indicators slipped as marketing time expanded
Key Trend Metrics(Year to Year):
Overall:
Median sales price increased 0.6% to $320,000
Average sales price slipped 2.2% to $425,740
Number of sales declined 7.5% to 3,104
Days on market was 91 up from 51
Listing discount was 5.7%, down from 5.9%
Listing inventory rose 6.9% to 12,247 units
Luxury Condo:
Median sales price slipped 6.9% to $780,000
Average price per square foot rose 4.9% to $468
Days on market was 160 days, down from 167
Listing discount was 7.2%, down from 7.4%
Listing inventory declined 0.3% to 2,759
Entry threshold began at $580,000, up 9.4%
Luxury Single Family:
Median sales price slipped 0.5% to $1,407,500
Average price per square foot slipped 0.9% to $439
Days on market was 133 days up from 76
Listing discount was 8.9%, up from 8.8%
Listing inventory rose 14.7% to 1,223 units
Entry threshold began at $880,000, down 4.6%
Fort Lauderdale
Overview:
Condo price trend indicators slid year over year with decline in average sales size
Condo sales declined annually for the first time in five quarters
Single-family price trend indicators were mixed as inventory expanded annually for the fifth straight quarter
Luxury condo pending sales signed in the quarter surged
Single family luxury median and average sales price moved higher as marketing time stabilized
Key Trend Metrics(Year to Year):
Luxury Condo:
Median sales price decreased 6.2% to $1,226,000
Average price per square foot rose 0.5% to $619
Days on market was 52, down 8.8%
Listing discount was 7.6%, up from 6.7%
Listing inventory rose 20.4% to 348 units
Entry threshold began at $875,000 down 7.9%
Luxury Single Family:
Median sales price rose 8% to $2,240,000
Average price per square foot slipped 2.6% to $530
Days on market was 163, unchanged
Listing discount was 14.9%, up from 8.1%
Listing inventory rose 19.6% to 396 units
Entry threshold began at $1,365,000, down 6.5%
Boca Raton/Highland Beach
Overview:
Condo & single family price trend indicators rose year over as sales slipped for the first time in three quarters
Condo & single family price trend indicators saw larger growth at the higher end of the market
Condo listing inventory fell annually for the second straight quarter
Luxury condo price trends surged year over year partially due to jump in average sales size
Key Trend Metrics(Year to Year):
Luxury Condo:
Median sales price jumped 48.3% to $1,175,000
Average price per square foot rose 39.2% to $522
Days on market was 146 days, up from 116
Listing discount was 8.2%, up from 7.3%
Listing inventory declined 21.4% to 313
Entry threshold began at $665,000, up 26.7%
Luxury Single Family:
Median sales price declined 14.9% to $1,830,000
Average price per square foot rose 9.1% to $455
Days on market was 136 days, up from 134
Listing discount was 9.4%, down from 9.4%
Delray Beach
Overview:
Single family sales slipped for the first time in six quarters as listing inventory expanded for four quarters
Condo price trend indicators haven’t declined in thirteen straight quarters
Luxury single family price trend indicators skewed lower by decline in average sales size
Key Trend Metrics(Year to Year)
Luxury Condo:
Median sales price declined 26.8% to $510,000
Days on market was 111, up from 88
Listing discount was 5.4%, down from 6.6%
Entry threshold began at $385,000, unchanged
Luxury Single Family:
Median sales price declined 1.4% to $2,045,250
Days on market was 143, up from 126
Listing discount was 9.7%, up from 8.7%
Entry threshold began at $1,298,000, down 1.6%
Wellington
Overview:
Condo median sales price increased annually for the tenth straight quarter
Condo inventory expanded year over year for the fourth consecutive quarter
Single-family price trend indicators all rose year over year for the fourth consecutive quarter
Single-family sales declined annually for the fourth time in the past five quarters
Luxury condo and single-family price trend indicators surged due to significant shift to larger average sales size
Key Trend Metrics(Year to Year)
Luxury Condo:
Median sales price surged 58.5% to $598,500
Average square footage jumped 14.6% to 2,288
Days on market was 154, down from 157
Listing discount was 1.8%, down from 3.7%
Listing inventory fell 46.8% to 33
Entry threshold began at $415,000, up 22.1%
Luxury Single Family:
Median sales price jumped 79.9% to $2,752,500
Average square footage surged 42.7% to 5,717
Days on market was 184, down from 262
Listing discount was 14.2%, up from 9.5%
Listing inventory declined 6.3% to 236
Entry threshold began at $885,000 down 1.1%
Palm Beach
Overview:
Condos sales rose annually for the fifth consecutive quarter to the second highest market share recorded
Most first quarter condo sales in four years while inventory increase annual for the fourth time in five quarters
Single family price trends showed mixed results as sales fell to their lowest first quarter total in seven years
Luxury average sales size fell sharply as the luxury price threshold fell annually for the fourth straight quarter
Key Trend Metrics(Year to Year)
Luxury Condo and Single Family:
Median sales price declined 29.2% to $7,100,000
Average sales size dropped 25.1% to 4,915 square feet
Average price per square foot fell 21.1% to $1,641
Days on market was 106, down from 122
Listing discount was 8.1%, down from 14.6%
Listing inventory jumped 27% to 127
Entry threshold began at $5,100,000, down 6%
Jupiter/Palm Beach Gardens
Jupiter Overview:
Single-family median sales price moved higher for the second straight month
Condo sales rose year over year for the third consecutive quarter
Palm Beach Gardens Overview:
Single-family sales slipped for the third time in four quarters as all price indicators rose
Condo median price slipped year over year for the first time in 27 quarters
Key Trend Metrics(Year to Year)
Jupiter Luxury Condo:
Median sales price rose 7% to $305,000
Days on market was 65, up from 46
Listing discount was 5.3%, up from 5.1%
Listing inventory rose 3.1% to 328
Jupiter Single Family:
Median sales price increase 6% to $530,000
Days on market was 71, down from 77
Listing discount was 5.4%, up from 6.5%
Listing inventory rose 11.1% to 481
Palm Beach Gardens Luxury Condo:
Median sales price slipped 2.1% to $235,000
Days on market was 71, up from 49
Listing discount was 4.1%, down from 4.5%
Listing inventory jumped 16.9% to 277
Palm Beach Gardens Single Family:
Median sales price increased 8.2% to $499,500
Days on market was 89, up from 83
Listing discount was 6.9%, down from 7.9%
Listing inventory rose 3% to 556
Article by Stephanie Warren
Douglas Elliman Releases Q4 Market Reports For South Florida
Douglas Elliman has released their Q4 Market Reports for South Florida, produced in conjunction with Miller Samuel a leading independent appraisal firm. The South Florida Market continued to show power in prices, continuing to increase in both the luxury and overall markets across nearly all markets including Miami Beach and Barrier Islands, Fort Lauderdale, etc.
Douglas Elliman has released their Q4 Market Reports for South Florida, produced in conjunction with Miller Samuel a leading independent appraisal firm. The South Florida Market continued to show power in prices, continuing to increase in both the luxury and overall markets across nearly all markets including Miami Beach and Barrier Islands, Fort Lauderdale, Boca Raton, DelRay Beach, Wellington, Palm Beach, Jupiter and Palm Beach Gardens.
MIAMI BEACH/BARRIER ISLANDS
Key Trend Metrics(Year Over Year)
Overview:
Single family sales surged as condo sales declined after a large burst of activity on the prior quarter
Condo price trend indicators declined from year ago levels, consistent with drop in average sales size
Luxury condo price trend indicators declined at same rate as average sales size
Luxury single-family sales size rose sharply driving price trend indicators higher
Luxury condo inventory increased as luxury single family inventory declined
Marketing time expanded as older listings were absorbed as negotiability expanded
Key Trend Metrics(Year Over Year)
Overall
Median sales price slipped 6.7% to $378,750
Average sales price increased 0.3% to $888,424
Number of sales slipped 10.4% to 678
Days on market was 146, up from 73
Listing discount was 10.9%, up from 810%
Listing inventory increased 3.8% to 6,668
Luxury Condo
Median sales price declined to $2,200,000
Average price per square foot decreased 13.5% to $1,047
Days on market was 222, up from 92
Listing discount was 12.6%, up from 11.3%
Listing inventory rose 20.5% to 1,459 units
Entry threshold began at $1,305,000
Luxury Single Family
Median sales price surged 33.3% to $8,000,000
Average price per square foot jumped 40.3% to $1,494
Days on market was 349, up from 170
Listing discount was 16.7%, up from 16.4%
Listing inventory fell 6.2% to 183 units
Entry threshold began at $5,900,000, up from 15.7%
MIAMI COASTAL MAINLAND
Overview:
Overall price trend indicators and the number of sales continued to rise year over year
Overall sales and all price trend indicators were above the level seen in 2017
Listing inventory trended higher for the fourth consecutive month
Market share of purchases with conventional financing was the highest in the five years
Nearly all luxury condo and single-family price trend indicators continued to rise greater year over year
Luxury condo inventory declined as luxury single family inventory expanded
Key Trend Metrics(Year Over Year)
Overall:
Median sales price increased 5.9% to $320,000
Average sales price rose 7.2% to $445,007
Number of sales rose 10.6% to 3,518
Days on market was 81 up from 44
Listing discount was 5.6%, down from 5.7%
Listing inventory rose 20.9% to 12,071 units
Luxury Condo
Median sales price slipped 3.8% to $812,500
Average price per square foot rose 4% to $470
Days on market was 178 days, up from 155
Listing discount was 7.8%, down from 8.1%
Listing inventory declined 18.9% to 2,505
Entry threshold began at $610,000, up 27.1%
Luxury Single Family
Median sales price rose 6.7% to $1,387,500
Average price per square foot jumped 16.8% to $479
Days on market was 130 days up from 67
Listing discount was 8.5%, up from 8.4%
Listing inventory rose 12.6% to 1,111 units
Entry threshold began at $890,000, up 3.5%
Fort Lauderdale
Overview:
Condo sales rose above for the fourth consecutive quarter
Condo listing inventory rose for the first time in six quarters
Single family price trend indicators were mixed as condos moved higher
Condo luxury price trend indicators surged
Single family luxury price trend indicators showed mixed results as average sales size declined
Key Trend Metrics(Year Over Year)
Overall:
Luxury Condo
Median sales price increased 25.8% to $1,550,000
Average price per square foot rose 21.1% to $619
Days on market was 131, down 34.5%
Listing discount was 5.6%, down from 7.7%
Listing inventory fell 28.7% to 256 units
Entry threshold began at $1,095,000 up 41.3%
Luxury Single Family
Median sales price rose 7.4% to $2,125,000
Average price per square foot slipped 4% to $572
Days on market was 176, down from 190
Listing discount was 9.5%, down from 16.4%
Listing inventory declined 7.4% to 338 units
Entry threshold began at $1,500,000, up 22%
BOCA RATON
Overview:
Condo median sales price hasn’t seen a year over year decline in ten quarters
Sales for condos and single-families have increased year over year for two consecutive quarters
Luxury condo and luxury single family price trends moved higher, consistent with rise in sales size
Key Trend Metrics(Year Over Year)
Overall:
Luxury Condo
Median sales price rose 9.4% to $902,500
Average price per square foot rose 32.8% to $466
Days on market was 108 days, up from 101
Listing discount was 6.7%, down from 8.9%
Listing inventory declined 13.7% to 308
Entry threshold began at $590,000, up 9.6%
Luxury Single Family
Median sales price rose 5.6% to $2,112,500
Average price per square foot rose 5.8% to $402
Days on market was 187 days, down from 217
Listing discount was 9.7%, down from 12.5%
Listing inventory edged up 1.7% to 408
Entry threshold began at $1,286,200 up 0.7%
DELRAY BEACH
Overview:
Single-family sales and median sales price have been rising year over year for four consecutive quarters
Condo median sales price showed twelve consecutive quarters without a year over year decline
Luxury single family price per square foot moved higher as the other indicators were pulled down sharply by drop in sales size
Key Trend Metrics (Year Over Year)
Luxury Condo
Median sales price rose 14.5% to $537,500
Days on market was 102, up from 66
Listing discount was 6.9%, up from 4.9%
Entry threshold began at $325,000, down 1.5%
Luxury Single Family
Median sales price declined 10.9% to $1,741,250
Days on market was 156, up from 104
Listing discount was 5.9%, down from 10.4%
Entry threshold began at $1,150,000, down 3.4%
WELLINGTON
Overview:
Condo median sales price year over year for the tenth consecutive quarter
Condo sales rose annual for three of the last four quarters
All single-family price trend indicators increased year over year for the third consecutive quarter
Luxury condo price trend indicators pulled lower by sharp decline in average sales size while the opposite occurred for luxury single-family price trends
Key Trend Metrics(Year Over Year)
Luxury Condo
Median sales price slipped 1.8% to $665,000
Average square footage declined 18.3% to 1,878
Days on market was 77, down from 148
Listing discount was 4.5%, down from 8.2%
Listing inventory jumped 52.2% to 35
Entry threshold began at $435,000, down 17.9%
Luxury Single Family
Median sales price jumped 88.2% to $2,000,000
Average square footage rose 1.7% to 4,662
Days on market was 195, up from 115
Listing discount was 8.9%, up from 7.7%
Listing inventory declined 33.6% to 186
Entry threshold began at $1,010,000 up 47.4%
Palm Beach
Overview:
Condos continued to dominate with the highest sales share
Single family and luxury price trend indicators skewed significantly lower by the sharp decline in average sales size
Majority fourth quarter market wide sales in 5 years
Luxury inventory returned to more modest levels after limited availability over the past two years
Key Trend Metrics (Year Over Year)
Luxury Family And Single Condo
Median sales price declined 57.8% to $6,426,750
Average price per square foot fell 22.5% to $1,443
Average sales size dropped 52.1% to 4,515 square feet
Days on market was 100, down from 496
Listing discount was 9.1%, down from 18.3%
Listing inventory jumped 104.1% to 100
Entry threshold began at $4,250,000, down 59.9%
JUPITER / PALM BEACH GARDENS
Jupiter Overview:
Single family price trend indicators and sales moved higher
Condo sales and price trend indicators all rose for the third consecutive quarter
Palm Beach Gardens Overview:
Single-family price trend indicators showed double-digit gains as sales decreased
Condo sales slipped again as price trend indicators continued to rise
Key Trend Metrics (Year Over Year)
Jupiter Single Family
Median sales price jumped 15.4% to $525,000
Days on market was 70, up from 62
Listing discount was 5.8%, up from 5.6%
Listing inventory declined 5.7% to 413
Jupiter Condo
Median sales price rose 11.3% to $310,000
Days on market was 60, up from 59
Listing discount was 4.1%, down from 5.2%
Listing inventory rose 5.2% to 304
Palm Beach Gardens Single Family
Median sales price increased 10.6% to $470,000
Days on market was 82, unchanged
Listing discount was 7.8%, up from 6.6%
Listing inventory rose 5.2% to 527
Palm Beach Gardens Condo
Median sales price rose 2.1% to $240,000
Days on market was 52, up from 48
Listing discount was 3.9%, down from 4.6%
Listing inventory jumped 41.7% to 299
Article by Stephanie Warren
Douglas Elliman Releases Q2 Market Reports For South Florida As Pricing Continues To Rise
Douglas Elliman has released their Q2 Market Reports for South Florida, produced in conjunction with Miller Samuel, a leading independent appraisal firm. Despite the constant rumblings of a bubble or a crash, the South Florida market continued to show strength and prices continuing to push higher in both the luxury and overall markets across nearly all markets
Douglas Elliman has released their Q2 Market Reports for South Florida, produced in conjunction with Miller Samuel, a leading independent appraisal firm. Despite the constant rumblings of a bubble or a crash, the South Florida market continued to show strength and prices continuing to push higher in both the luxury and overall markets across nearly all markets including Miami Beach, Miami coastal mainland, Fort Lauderdale, Boca Raton, Delray Beach and Jupiter. The quarter also reflected the most sales in 3 years in both Miami Beach and Delray Beach. The general health of the market should remain strong as South Florida continues to be a haven for flight capital and population growth, matched with fast-growing world-class cities, a high quality of life and no state income tax.
Miami Beach & Barrier Islands
- Price trend indicators posted strong gains across the overall and luxury markets
- Number of sales and pending sales moved up from year ago levels
- Although listing inventory has been rising for more than four years the rate of growth has eased considerably in past year
- Overall days on market and listing discount expanded as older listing inventory was cleared from the market
- Most second quarter sales in three years
- Luxury condo average sales size surged and pending sales posted strong gains
- Luxury listing inventory slipped
Key Trend Metrics (Year Over Year)
Overall:
- Median sales price rose 7% to $438,000
- Average sales price increased 15.8% to $1,098,024
- Number of sales increased 10.7% to 1,025
- Days on market was 148, up from 139
- Listing discount was 11%, up from 9.7%
- Listing inventory increased 3.9% to 6,319
Luxury Condo:
- Median sales price surged 47.6% to $3,370,000
- Days on market was 196, up from 194
- Listing discount was 12.7%, up from 11.4%
- Listing inventory fell 20.3% to 959 units
- Entry threshold began at $1,900,000
Luxury Single Family:
- Median sales price jumped 34.5% to $10,760,000
- Days on market was 262, down from 292
- Listing discount was 16.5%, up from 14.5%
- Listing inventory jumped 32.3% to 209 units
- Entry threshold began at $4,950,000
Miami Coastal Mainland
- Overall conditions reflect rising prices, stable sales and modest inventory gains
- Median sales price increased year over year for the 15th consecutive quarter
- Highest market share of conventional financing in more than five years of recording
- One in four single family sales and half of condo sales were purchased with cash
- Number of sales well above the 5-year quarterly average
- Listing inventory edged higher for second quarter after six consecutive quarters of year over year declines
Key Trend Metrics (Year Over Year)
Overall:
- Median sales price increased 6.7% to $320,000
- Average sales price rose 8.8% to $456,591
- Number of sales fell 0.3% to 4,191
- Days on market was 86 up from 79
- Listing discount was 5.6%, up from 5.5%
- Listing inventory rose 2.7% to 11,184 units
Luxury Condo:
- Median sales price rose 6.4% to $814,951
- Days on market was 176 days, up from 169
- Listing discount was 8.1%, up from 7.7%
- Listing inventory declined 6.3% to 2,537
- Entry threshold began at $580,000
Luxury Single Family:
- Median sales price rose 6.7% to $1,600,000
- Days on market was 125 days down from 133
- Listing discount was 7.9%, up from 7.7%
- Listing inventory slipped 1.1% to 1,012 units
- Entry threshold began at $960,000
Fort Lauderdale
- Sharp price gains in the overall condo and single family markets
- All condo price indicators set new records
- Overall condo market showed a large burst in year over year sales in last two quarters
- Large gain in conventional financial market share for both property types
- Luxury listing inventory fell sharply across property types
Key Trend Metrics (Year over Year)
Luxury Condo:
- Median sales price increased 9.8% to $1,281,600
- Days on market was 81, up from 68
- Listing discount was 6.8%, up from 5.6%
- Listing inventory fell 31.8% to 255 units
- Entry threshold began at $975,000
Luxury Single Family:
- Median sales price rose 35% to $2,265,000
- Days on market was 167, up from 155
- Listing discount was 9.2%, up from 8.2%
- Listing inventory declined 15.6% to 298 units
- Entry threshold began at $1,500,000
Boca Raton
- Overall price trends for both condos and single families increased year over year
- Sales slipped an inventory edged higher for both property types from the year ago quarter
- Share rise in average sales size and price trend indicators for luxury condos
- Unlike overall market, listing inventory for luxury properties declined
- Luxury pending sales are up year over year
Key Trend Metrics (Year Over Year)
Luxury Condo:
- Median sales price rose 24.8% to $1,051,250
- Average sales price surged 31.3% to $1,394,111
- Days on market was 128 days, up 14.3%
- Listing discount was 8.3%, unchanged
- Listing inventory fell 21.1% to 243
- Entry threshold began at $645,000
Luxury Single Family:
- Median sales price declined 4.8% to $1,900,000
- Average sales price rose 1.8% to $2,605,203
- Days on market was 142 days, down from 165
- Listing discount was 9.6%, up from 9.5%
- Listing inventory declined 25.8% to 419
- Entry threshold began at $1,250,000
Delray Beach
- Most price trend indicators for the overall market by condo and single family moved higher
- The number of sales for condos and single families market wide increased
- Marketing time fell across the overall market
- The negotiability of luxury single family and condos tightened
Key Trend Metrics (Year Over Year)
Luxury Single Family:
- Median sales price surged 12.3% to $1,737,500
- Days on market was 148, up from 118
- Listing discount was 8.7%, down from 11%
- Entry threshold began at $1,260,000
Luxury Condo:
- Median sales price declined 10% to $575,750
- Days on market was 80, down from 116
- Listing discount was 5.5%, down from 5.8%
- Entry threshold began at $390,000
Wellington
- Overall market price trend indicators moved higher over both property types
- Listing inventory and sales were up slightly across most segments of the market
- Luxury single family prices and sales size were up sharply
- Smaller luxury condo sales size skewed most price indicators lower
Key Trend Metrics (Year Over Year)
Luxury Condo:
- Median sales price fell 23.2% to $437,500
- Average square footage fell 11.9% to 2,034
- Days on market was 182, up from 160
- Listing discount was 5.9%, unchanged
- Listing inventory rose 8.3% to 52
- Entry threshold began at $350,000
Luxury Single Family:
- Median sales price jumped 34.4% to $2,150,000
- Average square footage rose 17.3% to 4,877
- Days on market was 176, up from 167
- Listing discount was 14.9%, up from 14.4%
- Listing inventory rose 4.3% to 218
- Entry threshold began at $845,000
Palm Beach
- Highest combined number of condo and single family sales in three years
- Listing inventory fell across the market by property type
- Condo price trends declined, skewed by shift to smaller sized sales
- Luxury inventory and days on market expanded
Key Trend Metrics (Year Over Year)
Luxury Condo & Single Family:
- Median sales price declined 20.8% to $12,537,970
- Days on market was 148, down from 140
- Listing discount was 17.7%, up from 15.3%
- Listing inventory rose 30.2% to 69
- Entry threshold began at $6,786,250
Jupiter/ Palm Beach Gardens
Jupiter:
- Single family price trend indicators increased as sales and inventory declined
- Condo price trend indicators rose sharply as sales declined
Palm Beach Gardens:
- Single family price trend indicators were mixed as sales and inventory declined
- Condo price trend indicators for the overall markets continued to rise
Key Trend Metrics (Year Over Year)
Jupiter Single Family:
- Median sales price increased 7.3% to $515,000
- Days on market was 60, down from 69
- Listing discount was 5.2%, down from 6.5%
- Listing inventory declined 8% to 402
Jupiter Condo:
- Median sales price rose 12.9% to $315,000
- Days on market was 65, up from 62
- Listing discount was 4.6%, down from 4.9%
- Listing inventory rose 11.7% to 277
Palm Beach Gardens Single Family:
- Median sales price increased 4.8% to $492,500
- Days on market was 77, down from 86
- Listing discount was 6.9%, down from 7.6%
- Listing inventory declined 2.5% to 516
Palm Beach Gardens Condo:
- Median sales price rose 3% to $242,000
- Days on market was 52, down from 62
- Listing discount was 4.4%, down from 4.6%
- Listing inventory jumped 21% to 236
ISG Report Finds New Construction Condos In Miami East Of I-95 Are 83% Sold Out
Craig Studnicky's ISG World Miami Report has reported that new construction condos in Miami east of I-95 are 83% sold out. The report includes condos that are either proposed, under construction, pre-sold and recently delivered.
Craig Studnicky's ISG World Miami Report has reported that new construction condos in Miami east of I-95 are 83% sold out. The report includes condos that are either proposed, under construction, pre-sold and recently delivered. As developers have scaled back on launching new projects, the falling inventory levels have resulted in prices being pressured upwards. Only 5 buildings will break ground this year, followed by another 3 in 2019 and 3 in 2020. Since mid-2011, 20,008 new condo units have been built and only 3,294 remain unsold. Of those, only 875 are available pre-construction. The report finds that condos built since 1993 have averaged 229% appreciation, 9% annually; and, that closed sales for condos averaged $913,492 in 2017. The report also found low inventory of housing available in Miami-Dade with only 3.13% of total inventory available for sale or rent.
Miami Ranks As The Top U.S. Real Estate Market For Ultra-Rich Foreign Buyers Snatching Up Luxury Real Estate, Foreign Investment Tops $7 Billion
Miami has been named the top U.S. real estate market for ultra-rich foreign buyers of luxury real estate. According to the US Ultra Prime Real Estate Report, 26% of American ultra-luxury properties sold to overseas buyers were in Miami, with over 95% of the deals being completed in cash.
Miami has been named the top U.S. real estate market for ultra-rich foreign buyers of luxury real estate. According to the US Ultra Prime Real Estate Report, 26% of American ultra-luxury properties sold to overseas buyers were in Miami, with over 95% of the deals being completed in cash. Miami was followed by Los Angeles at 9% and Manhattan at 3%, with ultra-luxury defined as properties costing in excess of $2,700 SF. 80% of Miami's ultra-luxury property market were sold to overseas buyers while 20% was picked up by domestic buyers. Lifestyle played a major factor in the demand for ultra-luxury real estate in Miami, where residents can enjoy warm weather year round matched with clean, beautiful beaches and world-class dining, shopping, and entertainment.
"Miami has it all, the weather, the beaches, and now Miami truly has world-class metro city centers," says Demetri Demascus a top-producer at Spectrum Realty Group. "When people travel to Miami now they are blown away with how the city has changed over the past few years. Everyone wants to live here. Compared to other prime real estate markets, ultra-luxury real estate Miami can still be purchased at a discount and the government doesn't punish you with taxes and fees for buying or owning it. Miami can offer safety from the political and economic crisis' in foreign buyers' home countries and there are many security options including high-security luxury condos and gated communities with 24/7 security. Miami also has some of the finest waterfront estates from top architects and builders like Choeff Levy Fischman and Todd Michael Glaser. There is so much variety whether it be a luxury home on North Bay Road, Pine Tree Drive, Star Island, Palm Island or a luxury condo on Fisher Island, in Porsche Design Tower or in One Thousand Museum; all with accessible modern luxuries such as Uber, Uber Eats, world-class dining and entertainment minutes away, there really is no city like it. People are coming from everywhere."
Foreign investment in South Florida homes totaled over $7 billion, 15,400 residential properties in 2017, up from $6.2 billion, 10,900 properties in 2016. Venezuelans spent the most in Miami-Dade for the second year in a row, while Argentinians spent the most in South Florida accounting for over 15% of overseas purchases. Venezuelans purchased 11%, followed by Canadians and Colombians at 9% and Brazilians at 8%. 51% of the deals were in Miami-Dade county led by Venezuelans at 12%, Argentinians and Brazilians at 9%, Colombians at 5%, French at 4% and Ecuadorians and Italians at 3%. In Broward County Canadians accounted for 12% of foreign purchases, Argentinians accounted for 8% of purchases and Brazil, Colombia and Venezuela accounted for 6% each. In Palm Beach Canadians accounted for 31% of overseas purchases and Brazilians accounted for $15%.
Florida Named Second Fastest Growing State Averaging 900 New Residents Per Day
Florida has been named the second fastest growing state according to the United States Census Bureau, trailing only Texas. Florida added 327,811 new residents between July 1, 2016 and July 1, 2017, about 900 new residents per day.
Florida has been named the second fastest growing state according to the United States Census Bureau, trailing only Texas. Florida added 327,811 new residents between July 1, 2016 and July 1, 2017, about 900 new residents per day. The recent influx of new residents has been bolstered by northern states extreme tax and financial struggles as local and state politicians continue to tighten the tax noose on residents. Florida has no income tax, which has attracted wealthy families and individuals from states like Connecticut, New York, New Jersey, and Massachusetts, amongst others at breakneck speed. Hedge fund big wig Paul Tudor Jones of Tudor Investment Corp. moved from Greenwich, Connecticut to Florida in 2015 after Connecticut passed two of the largest tax increases in history between 2011 and 2015, taking with him over $30 million in income tax revenue. In September 2016 PROFILEmiami reported that Barry Sternlicht, CEO of Starwood Capital Group and chairman of Starwood Property Trust, also fled Connecticut to become a Florida resident. Florida now has 1.1 million more residents than New York and is growing at a pace twenty five times faster than its northern counterpart which added only 13,113 new residents last year despite local claims the state is experiencing great growth. Florida is now the third most populous state behind only California and Texas. Now, Florida once again stands poised to continue and even accelerate growth as the Tax Cuts and Jobs Act of 2017 essentially makes Florida the model on which states should tax their residents. On December 22, 2017, President Donald Trump singed into law the Tax Cuts and Jobs Act of 2017, after the bill was passed by the United States Congress. The bill caps taxpayer's ability to deduct state individual income, sales and property taxes up to a limit of $10,000 starting in 2018. The current deduction was unlimited, allowing high tax states like New York to shift tax revenue from the federal government to state and local government. While residents of these high tax states have for years cautioned local politicians from continuing to hike taxes, taxes have continued to rise and the elimination of the SALT Deduction now makes it much more expensive to live in these states. As the effects of the tax cuts begin to be seen Florida's rapid population rise should be poised to continue through 2018.
Miami The 9th Most Expensive 1-Bedroom Rental Market In The U.S. According To Zumper's November Report
Miami has come in as the 9th most expensive city to rent a 1-bedroom with a median price of $1,750 according to Zumper's November report. This number reflects a fall from $1,800 median 1-bedroom rent that Miami reported in their October report studying numbers from September.
Miami has come in as the 9th most expensive city to rent a 1-bedroom with a median price of $1,750 according to Zumper's November report. This number reflects a fall from $1,800 median 1-bedroom rent that Miami reported in their October report studying numbers from September. The Zumper report analyzes active listings across 18 metro cities to show the most and least expensive cities and cities with the fastest growing rents. For the entire state of Florida, 1 bedroom state median was around $1,173 in September 2017.
In the October report, Miami remained the most expensive city to rent in the metro with 1 bedroom units priced at $1,800, down .6% year-over-year. Boca Raton narrowly beat Miami Beach to become the second most expensive city with a median rent of $1,620, up 14.1% year-over-year. Miami Beach fell 3.6% year-over-year, coming in at $1,610. Homestead rent was the cheapest, seeing no change at $1,000 followed by Lauderhill at $1,030 which was up 8.4% and Coral Springs, which was down .9% at $1,140. Other notables include Hollywood which fell 1.4% to $1,380, Weston remained unchanged and $1,400 and not included is Fort Lauderdale, which comes in at $1,483, falling 1.1% year over year.
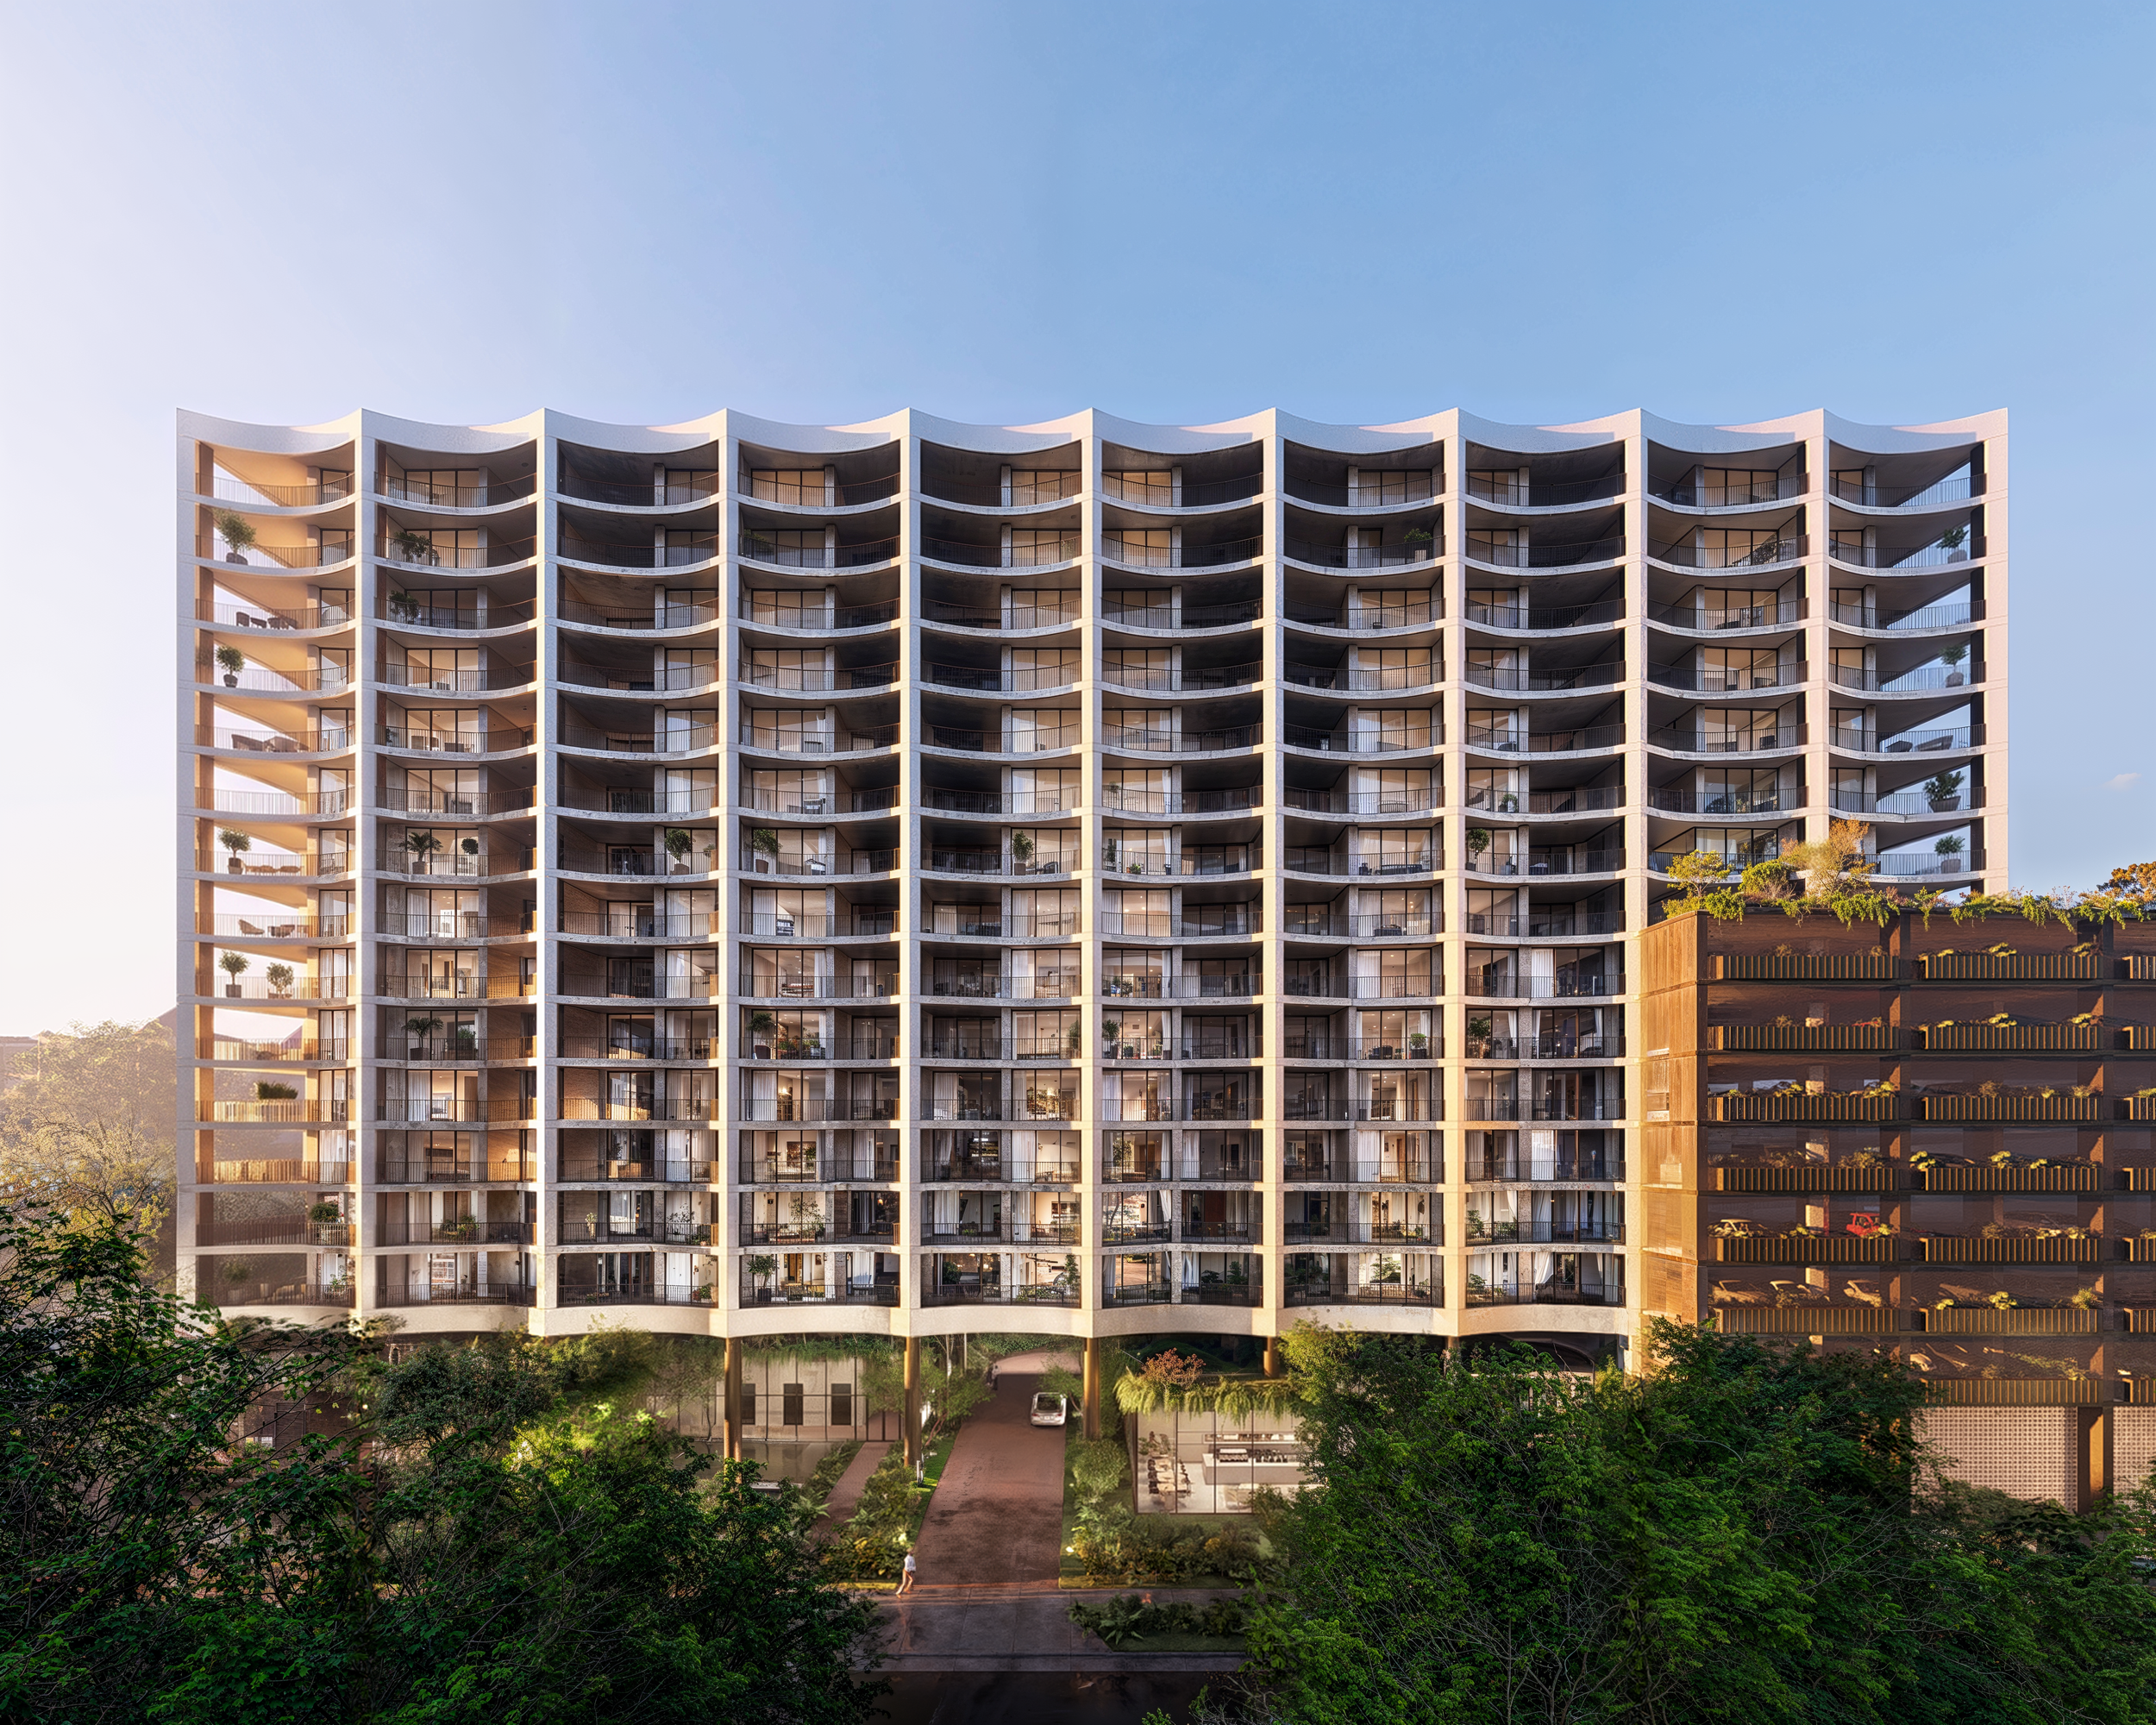
Mast Capital and BH Group have announced Raffles Residences Coconut Grove, the brand’s first standalone residential development, with 35 homes from $4.5 million and architecture by Brandon Haw.