
Douglas Elliman Releases Q2 2020 South Florida Market Reports
Douglas Elliman has just released their Q2 2020 Market Reports for South Florida, which were prepared by Miller Samuel, a leading independent appraisal firm. The reports, which cover the areas such as Boca Raton, Delray Beach, Fort Lauderdale, Miami Beach, and the Miami Coastal Mainland, have revealed that the COVID-19 market shutdown during much of the second quarter caused sales to fall sharply in South Florida.
Douglas Elliman has just released their Q2 2020 Market Reports for South Florida, which were prepared by Miller Samuel, a leading independent appraisal firm. The reports, which cover the areas such as Boca Raton, Delray Beach, Fort Lauderdale, Miami Beach, and the Miami Coastal Mainland, have revealed that the COVID-19 market shutdown during much of the second quarter caused sales to fall sharply in South Florida, despite the strength of the market in the first quarter.
Miami Beach/Barrier Islands
Overview:
Condo price trend indicators moved higher as the number of sales dropped during the shutdown
Single-family price trend indicators continued to decline along with sales and listing inventory year over year
Luxury condo price trend indicators pressed higher as listing inventory showed a slight gain
Key Trend Metrics (Year to Year)
Overall:
Median sales price rose 10.3% to $480,000
Average price per square foot edged up 6.1% to $659
Number of sales dropped 34.9% to 501
Listing inventory decreased by 0.5% to 6,393 units
Luxury Condo:
Median sales price increased by 11.6% to $2,850,000
Average price per square foot rose 4.8% to $1,231
Number of sales fell 37.7% to 43
Listing inventory slipped 3.0% to 1,095 units
Luxury Single Family:
Median sales price decreased by 22.6% to $7,200,000
Average price per square foot jumped 17.2% to $1,388
Number of sales had no change at 9
Listing inventory increased by 25.4% to 173 units
Miami Coastal Mainland
Overview:
Condo listing inventory and number of sales declined, median sales price reached a new record
Single-family median sales price rose to a new record as both sales and listing inventory fell sharply
Luxury condo price trend indicators showed mixed results as the number of sales saw a significant decline
Key Trend Metrics (Year to Year)
Overall:
Median sales price rose 4.4% to $355,000
Average price per square foot increased by 5.1% to $289
Number of sales dropped 20.1% to 2,672
Listing inventory declined by 7.8% to 9,699 units
Luxury Condo:
Median sales price fell 14.0% to $805,000
Average price per square foot dropped 0.6% to $489
Number of sales declined by 33.5% to 115
Listing inventory increased by 13.4% to 2,508 units
Luxury Single Family:
Median sales price fell 11.9% to $1,410,000
Average price per square foot rose 25.5% to $557
Number of sales decreased by 6.1% to 153
Listing inventory dropped 1.1% to 915 units
Fort Lauderdale
Overview:
Condo sales dropped at the highest rate in more than thirteen years as all price trend indicators rose annually
Single-family sales fell at the largest rate since 2007 as median sales price stabilized
Luxury condo price trend indicators increased above year-ago levels at their most robust rate in six quarters
Key Trend Metrics (Year to Year)
Luxury Condo:
Median sales price rose 6.0% to $1,282,330
Average price per square foot increased by 5.2% to $587
Number of sales slipped 27.5% to 37
Listing inventory declined by 16.5% to 283 units
Luxury Single Family:
Median sales price dropped 22.5% to $2,500,000
Average price per square foot decreased by 23.9% to $596
Number of sales fell 20.5% to 35
Listing inventory declined by 12.5% to 259 units
Boca Raton/Highland Beach
Overall:
Condo sales declined year over year at its highest rate in 13 years as median sales price increased
Single-family sales declined year over year at its highest rate in 13 years as median sales price surged
Luxury condo median sales price declined while luxury single-family median sales price rose
Key Trend Metrics (Year to Year)
Luxury Condo:
Median sales price fell 23.0% to $885,000
Average price per square foot slipped 13.0% to $461
Number of sales declined by 21.2% to 52
Listing inventory surged 11.2% to 328
Luxury Single Family:
Median sales price dropped 13.1% to $2,215,000
Average price per square foot decreased by 12.6% to $382
Number of sales slipped 12.1% to 51
Listing inventory declined by 0.3% to 304 units
Delray Beach
Overview:
Single-family sales declined at the largest year over year rate in over thirteen years as the market paused
Condo median sales price was unchanged year over year, the eighteenth straight quarter without a decline
Luxury single-family listing inventory declined annually as luxury condo listing inventory saw a large gain
Key Trend Metrics (Year to Year)
Luxury Condo:
Median sales price decreased by 6.7% to $810,500
Average price per square foot rose 6.7% to $445
Number of sales slipped 24.6% to 46
Listing inventory surged 20.9% to 208 units
Luxury Single Family:
Median sales price dropped 0.6% to $2,087,500
Average price per square foot fell 13.7% to $504
Number of sales declined by 15.2% to 28
Listing inventory increased by 5.7% to 130
Wellington
Overview:
Condo sales declined sharply as median sales price increased year over year for the fifteenth straight quarter
Single-family listing inventory and sales showed sharp declines from prior year levels
Luxury listing inventory across both property types jumped from prior year
Key Trend Metrics (Year to Year)
Luxury Condo:
Median sales price fell 19.9% to $585,000
Average price per square foot dropped 10.1% to $313
Number of sales increased by 16.7% to 7
Listing inventory rose 72.2% to 62 units
Luxury Single Family:
Median sales price declined 24.3% to $1,135,000
Average price per square foot slipped 34.9% to $426
Number of sales jumped 15.0% to 23
Listing inventory increased by 9.2% to 226 units
Palm Beach
Overview:
Condo price trend indicators jumped as the largest average sales size in two years skewed them higher
Single-family listing inventory fell by the largest rate in seven years of tracking
Luxury listing inventory showed a substantial drop as price trend indicators surged year over year
Key Trend Metrics (Year to Year)
Luxury Condo and Single Family:
Median sales price surged 33.1% to $14,000,000
Average price per square foot rose 18.4% to $2,180
Number of sales dropped 30.8% to 9
Listing inventory declined by 65.6% to 22 units
Jupiter/Palm Beach Gardens
Jupiter Overview:
Single-family sales price trend indicators and sales continued to show substantial year over year growth
Condo price trend indicators rose year over year for the fourth straight quarter
Palm Beach Gardens Overview:
Single-family sales fell at their most significant rate in fourteen years
Condo price trend indicators rose year over year for the third consecutive quarter
Key Trend Metrics (Year to Year)
Jupiter Luxury Condo:
Median sales price decreased by 19.9% to $733,000
Average price per square foot dropped 10.6% to $404
Number of sales fell 13.6% to 19
Listing inventory increased by 16.7% to 63 units
Jupiter Luxury Single Family:
Median sales price declined by 11.5% to $2,300,000
Average price per square foot decreased by 2.9% to $647
Number of sales fell 7.4% to 25
Listing inventory dropped 15.3% to 111 units
Palm Beach Gardens Luxury Condo:
Median sales price fell 26.7% to $440,000
Average price per square foot dropped 24.1% to $239
Number of sales declined by 19.0% to 17
Listing inventory surged 67.4% to 72 units
Palm Beach Gardens Luxury Single Family:
Median sales price jumped 21.2% to $2,347,500
Average price per square foot rose 8.7% to $501
Number of sales decreased by 23.1% to 20
Listing inventory dropped 27.5% to 95 units
By Isabella Zimmermann
Douglas Elliman Releases June 2020 New Signed Contracts Report for Florida
Douglas Elliman in conjunction with Miller Samuel, a leading independent appraisal firm, has released its second monthly recurring report for June 2020. The report focuses on the new contracts signed and new listings that entered the rapidly changing market in Douglas Elliman’s Florida regions of Miami-Dade, Broward, Palm Beach, Pinellas, and Hillsborough.
Douglas Elliman in conjunction with Miller Samuel, a leading independent appraisal firm, has released its second monthly recurring report for June 2020. The report focuses on the new contracts signed and new listings that entered the rapidly changing market in Douglas Elliman’s Florida regions of Miami-Dade, Broward, Palm Beach, Pinellas, and Hillsborough. Overall, there was a surge in new signed contracts far exceeding year-ago levels, with excess demand coming from the Northeast. However, new inventory level gains have not kept pace with the growth in new contracts.
New contracts and new listings for each property type have been broken out by eight price tranches depending on regional pricing, on a year to year basis. Douglas Elliman will release a similar report to this one once again during the first week of August to disclose data regarding the number of new contracts signed and new listings during the month of July.
Palm Beach County
Key Trend Metrics (Year to Year)
Single Family:
Number of new signed contracts soared 71.3% to 4,261 contracts
Listing inventory dropped 19.9% to 1,604 units
642 single family homes priced above $1M went into contract, a 114.7% increase from last year
Condo:
Number of new signed contracts jumped 76.0% to 2,626 contracts
Listing inventory surged 4.2% to 1,175 units
Condos priced between $200K and $299K saw a 107.6% incline in the number of signed contracts for a total of 467
Broward County
Key Trend Metrics (Year to Year)
Single Family:
Number of new signed contracts rose 76.1% to 4,336 contracts
Listing inventory decreased by 27.0% to 1,622 units
There was a 123.2% increase in the number of signed contracts for homes priced between $600K and $799K
Condo:
Number of new signed contracts surged 61.4% to 3,154 contracts
Listing inventory fell 14.2% to 1,403 units
78 condos priced between $500K and $599K went into contract, a 116.7% jump from last year
Miami-Dade County
Key Trend Metrics (Year to Year)
Single Family:
Number of new signed contracts edged up 74.3% to 3,955 contracts
Listing inventory dropped 25.0% to 1,426 units
There were 172 homes priced between $800K and $99K that went into contract, a 123.4% increase from last year for similarly priced homes
Condo:
Number of new signed contracts climbed 54.6% to 4,093 contracts
Listing inventory slipped 4.0% to 1,918 units
643 condos priced between $200K and $299K went into contract compared to last year’s 344
Pinellas County
Key Trend Metrics (Year to Year)
Single Family:
Number of new signed contracts surged 95.9% to 2,897 contracts
Listing inventory decreased by 26.9% to 1,031 units
There was a 148.8% rise in homes priced between $500K and $599K that went into contract
Condo:
Number of new signed contracts increased by 93.4% to 1,408 contracts
Listing inventory fell 12.0% to 512 units
28 condos priced between $800K and $999K went into contract, a 250.0% surge from last year’s 8
Hillsborough County
Key Trend Metrics (Year to Year)
Single Family:
Number of new signed contracts rose 98.2% to 4,524 contracts
Listing inventory declined 32.1% to 1,550 units
There was a 223.9% jump in the number of new signed contracts for homes priced at or above $1M
Condo:
Number of new signed contracts grew 124.0% to 616 contracts
Listing inventory declined 18.9% to 223 units
Condos priced at or above $1M saw a drastic increase of 1633.3% in the number of new signed contracts for a total of 52
by Isabella Zimmermann
Douglas Elliman Releases Q2 Market Reports For South Florida As Pricing Continues To Rise
Douglas Elliman has released their Q2 Market Reports for South Florida, produced in conjunction with Miller Samuel, a leading independent appraisal firm. Despite the constant rumblings of a bubble or a crash, the South Florida market continued to show strength and prices continuing to push higher in both the luxury and overall markets across nearly all markets
Douglas Elliman has released their Q2 Market Reports for South Florida, produced in conjunction with Miller Samuel, a leading independent appraisal firm. Despite the constant rumblings of a bubble or a crash, the South Florida market continued to show strength and prices continuing to push higher in both the luxury and overall markets across nearly all markets including Miami Beach, Miami coastal mainland, Fort Lauderdale, Boca Raton, Delray Beach and Jupiter. The quarter also reflected the most sales in 3 years in both Miami Beach and Delray Beach. The general health of the market should remain strong as South Florida continues to be a haven for flight capital and population growth, matched with fast-growing world-class cities, a high quality of life and no state income tax.
Miami Beach & Barrier Islands
- Price trend indicators posted strong gains across the overall and luxury markets
- Number of sales and pending sales moved up from year ago levels
- Although listing inventory has been rising for more than four years the rate of growth has eased considerably in past year
- Overall days on market and listing discount expanded as older listing inventory was cleared from the market
- Most second quarter sales in three years
- Luxury condo average sales size surged and pending sales posted strong gains
- Luxury listing inventory slipped
Key Trend Metrics (Year Over Year)
Overall:
- Median sales price rose 7% to $438,000
- Average sales price increased 15.8% to $1,098,024
- Number of sales increased 10.7% to 1,025
- Days on market was 148, up from 139
- Listing discount was 11%, up from 9.7%
- Listing inventory increased 3.9% to 6,319
Luxury Condo:
- Median sales price surged 47.6% to $3,370,000
- Days on market was 196, up from 194
- Listing discount was 12.7%, up from 11.4%
- Listing inventory fell 20.3% to 959 units
- Entry threshold began at $1,900,000
Luxury Single Family:
- Median sales price jumped 34.5% to $10,760,000
- Days on market was 262, down from 292
- Listing discount was 16.5%, up from 14.5%
- Listing inventory jumped 32.3% to 209 units
- Entry threshold began at $4,950,000
Miami Coastal Mainland
- Overall conditions reflect rising prices, stable sales and modest inventory gains
- Median sales price increased year over year for the 15th consecutive quarter
- Highest market share of conventional financing in more than five years of recording
- One in four single family sales and half of condo sales were purchased with cash
- Number of sales well above the 5-year quarterly average
- Listing inventory edged higher for second quarter after six consecutive quarters of year over year declines
Key Trend Metrics (Year Over Year)
Overall:
- Median sales price increased 6.7% to $320,000
- Average sales price rose 8.8% to $456,591
- Number of sales fell 0.3% to 4,191
- Days on market was 86 up from 79
- Listing discount was 5.6%, up from 5.5%
- Listing inventory rose 2.7% to 11,184 units
Luxury Condo:
- Median sales price rose 6.4% to $814,951
- Days on market was 176 days, up from 169
- Listing discount was 8.1%, up from 7.7%
- Listing inventory declined 6.3% to 2,537
- Entry threshold began at $580,000
Luxury Single Family:
- Median sales price rose 6.7% to $1,600,000
- Days on market was 125 days down from 133
- Listing discount was 7.9%, up from 7.7%
- Listing inventory slipped 1.1% to 1,012 units
- Entry threshold began at $960,000
Fort Lauderdale
- Sharp price gains in the overall condo and single family markets
- All condo price indicators set new records
- Overall condo market showed a large burst in year over year sales in last two quarters
- Large gain in conventional financial market share for both property types
- Luxury listing inventory fell sharply across property types
Key Trend Metrics (Year over Year)
Luxury Condo:
- Median sales price increased 9.8% to $1,281,600
- Days on market was 81, up from 68
- Listing discount was 6.8%, up from 5.6%
- Listing inventory fell 31.8% to 255 units
- Entry threshold began at $975,000
Luxury Single Family:
- Median sales price rose 35% to $2,265,000
- Days on market was 167, up from 155
- Listing discount was 9.2%, up from 8.2%
- Listing inventory declined 15.6% to 298 units
- Entry threshold began at $1,500,000
Boca Raton
- Overall price trends for both condos and single families increased year over year
- Sales slipped an inventory edged higher for both property types from the year ago quarter
- Share rise in average sales size and price trend indicators for luxury condos
- Unlike overall market, listing inventory for luxury properties declined
- Luxury pending sales are up year over year
Key Trend Metrics (Year Over Year)
Luxury Condo:
- Median sales price rose 24.8% to $1,051,250
- Average sales price surged 31.3% to $1,394,111
- Days on market was 128 days, up 14.3%
- Listing discount was 8.3%, unchanged
- Listing inventory fell 21.1% to 243
- Entry threshold began at $645,000
Luxury Single Family:
- Median sales price declined 4.8% to $1,900,000
- Average sales price rose 1.8% to $2,605,203
- Days on market was 142 days, down from 165
- Listing discount was 9.6%, up from 9.5%
- Listing inventory declined 25.8% to 419
- Entry threshold began at $1,250,000
Delray Beach
- Most price trend indicators for the overall market by condo and single family moved higher
- The number of sales for condos and single families market wide increased
- Marketing time fell across the overall market
- The negotiability of luxury single family and condos tightened
Key Trend Metrics (Year Over Year)
Luxury Single Family:
- Median sales price surged 12.3% to $1,737,500
- Days on market was 148, up from 118
- Listing discount was 8.7%, down from 11%
- Entry threshold began at $1,260,000
Luxury Condo:
- Median sales price declined 10% to $575,750
- Days on market was 80, down from 116
- Listing discount was 5.5%, down from 5.8%
- Entry threshold began at $390,000
Wellington
- Overall market price trend indicators moved higher over both property types
- Listing inventory and sales were up slightly across most segments of the market
- Luxury single family prices and sales size were up sharply
- Smaller luxury condo sales size skewed most price indicators lower
Key Trend Metrics (Year Over Year)
Luxury Condo:
- Median sales price fell 23.2% to $437,500
- Average square footage fell 11.9% to 2,034
- Days on market was 182, up from 160
- Listing discount was 5.9%, unchanged
- Listing inventory rose 8.3% to 52
- Entry threshold began at $350,000
Luxury Single Family:
- Median sales price jumped 34.4% to $2,150,000
- Average square footage rose 17.3% to 4,877
- Days on market was 176, up from 167
- Listing discount was 14.9%, up from 14.4%
- Listing inventory rose 4.3% to 218
- Entry threshold began at $845,000
Palm Beach
- Highest combined number of condo and single family sales in three years
- Listing inventory fell across the market by property type
- Condo price trends declined, skewed by shift to smaller sized sales
- Luxury inventory and days on market expanded
Key Trend Metrics (Year Over Year)
Luxury Condo & Single Family:
- Median sales price declined 20.8% to $12,537,970
- Days on market was 148, down from 140
- Listing discount was 17.7%, up from 15.3%
- Listing inventory rose 30.2% to 69
- Entry threshold began at $6,786,250
Jupiter/ Palm Beach Gardens
Jupiter:
- Single family price trend indicators increased as sales and inventory declined
- Condo price trend indicators rose sharply as sales declined
Palm Beach Gardens:
- Single family price trend indicators were mixed as sales and inventory declined
- Condo price trend indicators for the overall markets continued to rise
Key Trend Metrics (Year Over Year)
Jupiter Single Family:
- Median sales price increased 7.3% to $515,000
- Days on market was 60, down from 69
- Listing discount was 5.2%, down from 6.5%
- Listing inventory declined 8% to 402
Jupiter Condo:
- Median sales price rose 12.9% to $315,000
- Days on market was 65, up from 62
- Listing discount was 4.6%, down from 4.9%
- Listing inventory rose 11.7% to 277
Palm Beach Gardens Single Family:
- Median sales price increased 4.8% to $492,500
- Days on market was 77, down from 86
- Listing discount was 6.9%, down from 7.6%
- Listing inventory declined 2.5% to 516
Palm Beach Gardens Condo:
- Median sales price rose 3% to $242,000
- Days on market was 52, down from 62
- Listing discount was 4.4%, down from 4.6%
- Listing inventory jumped 21% to 236
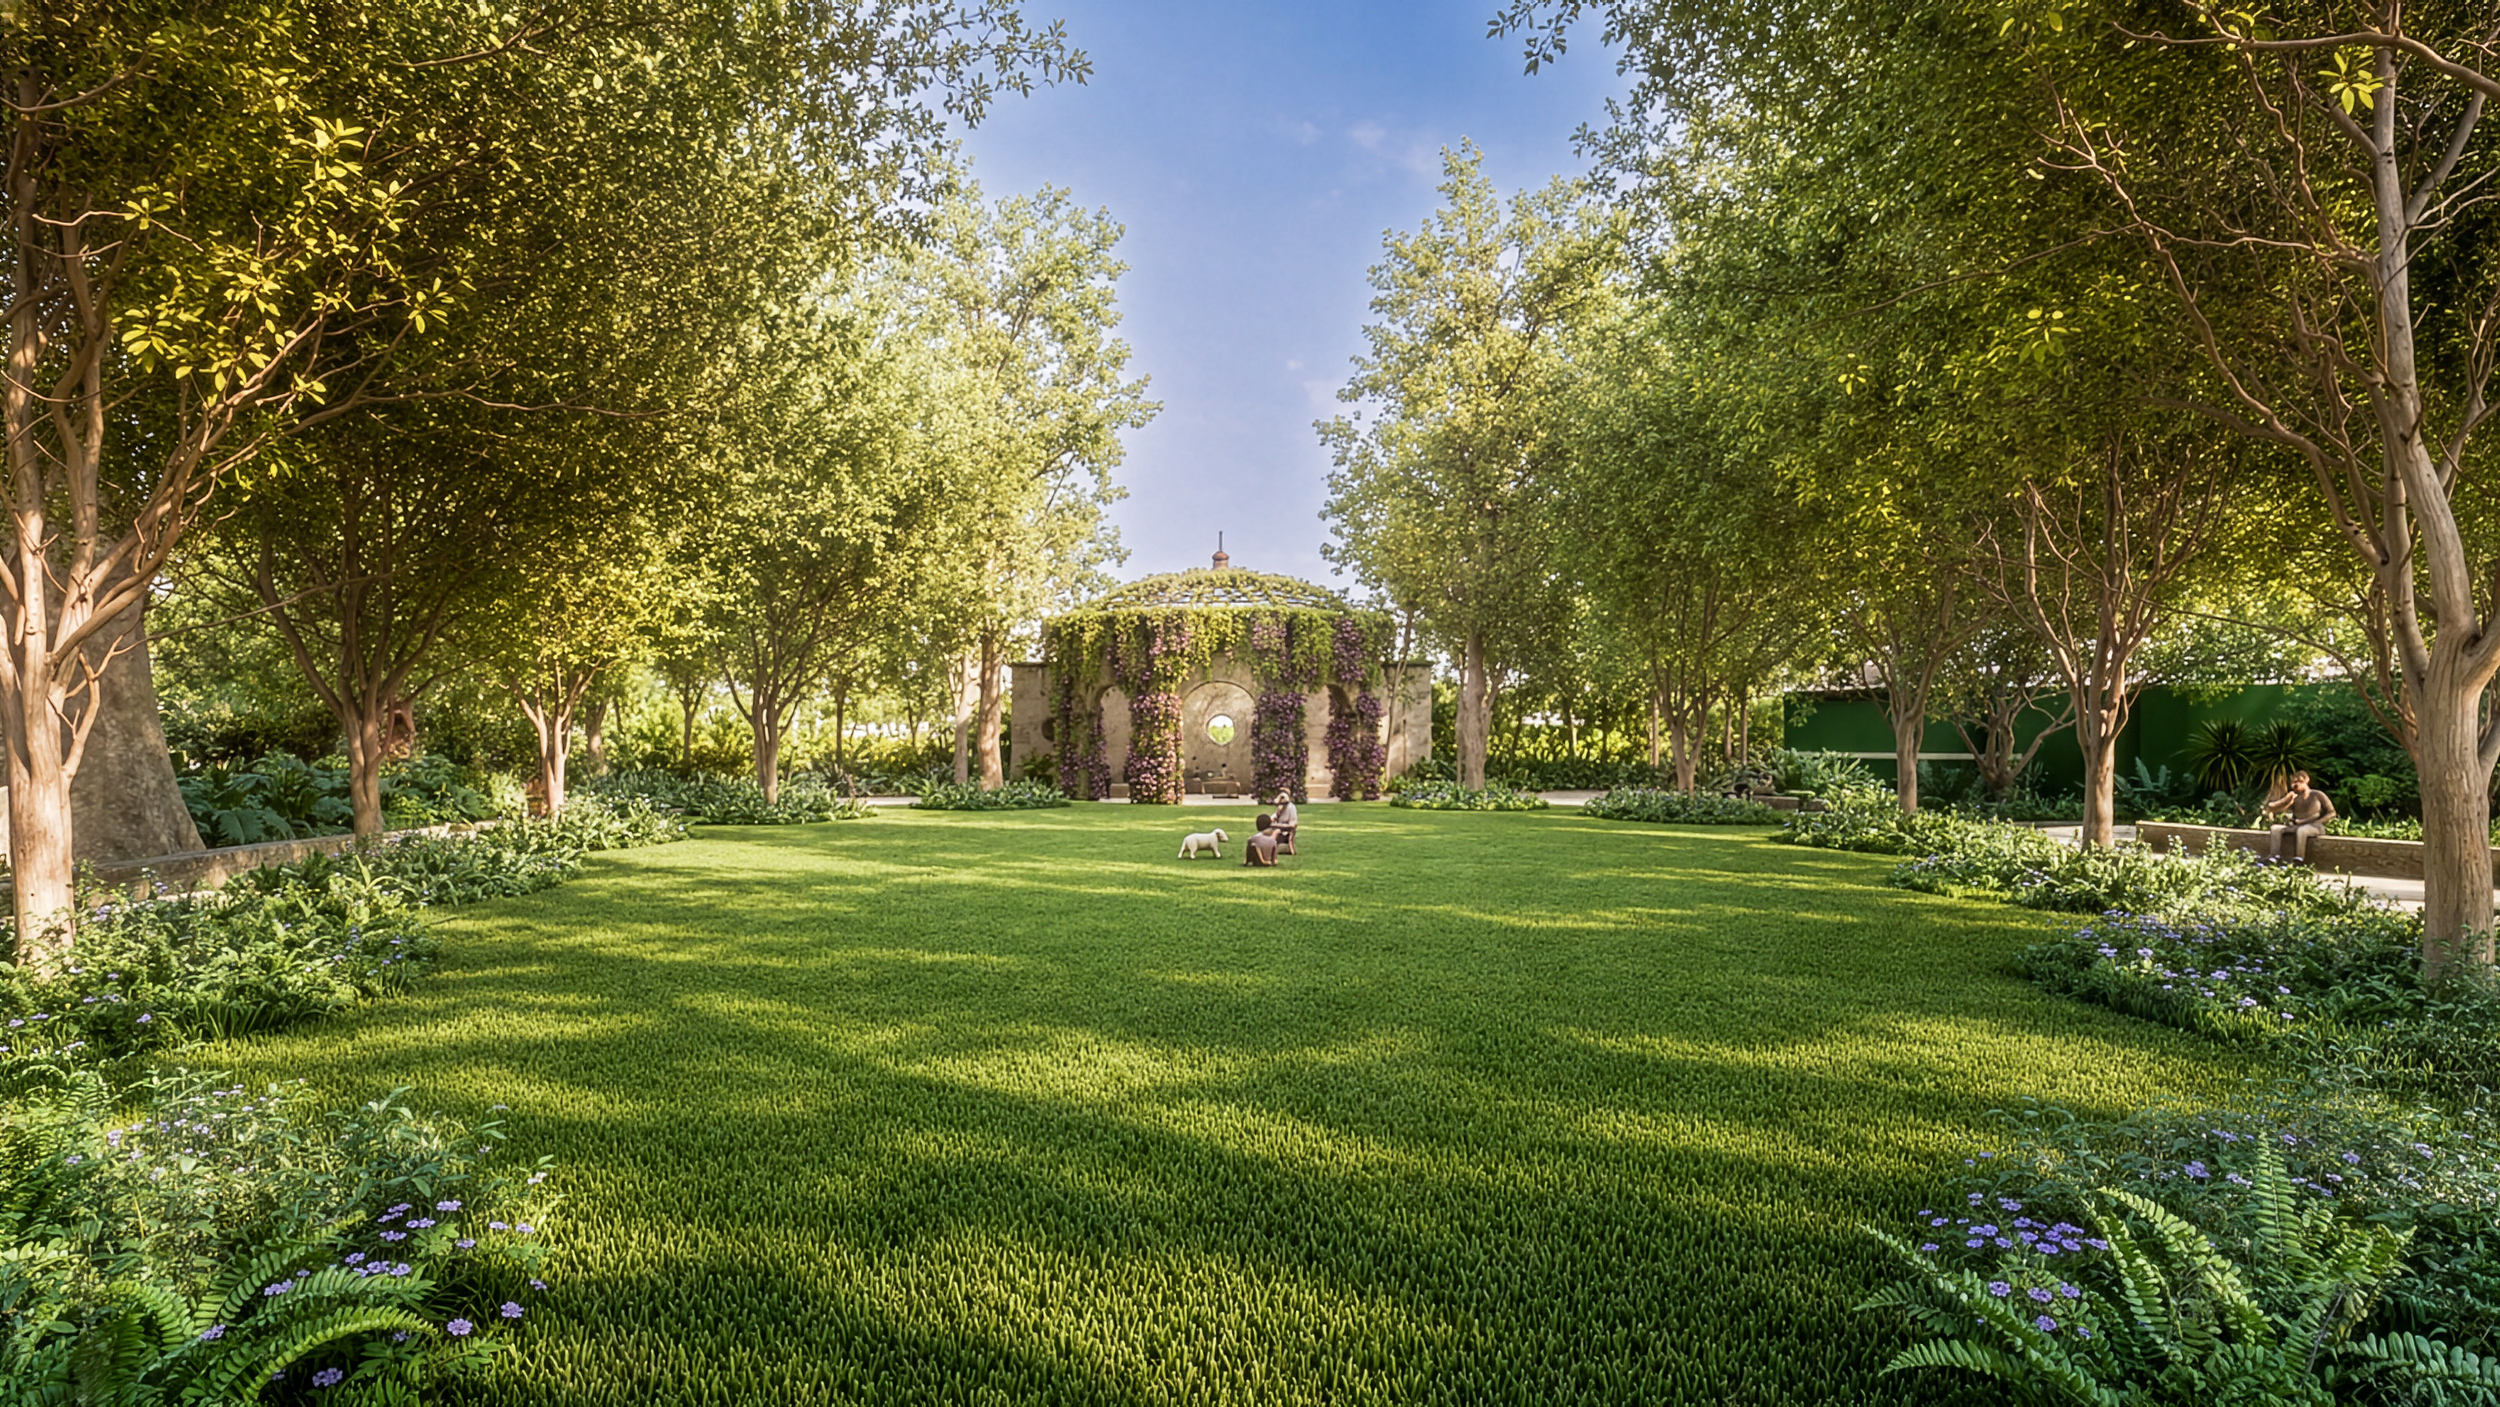
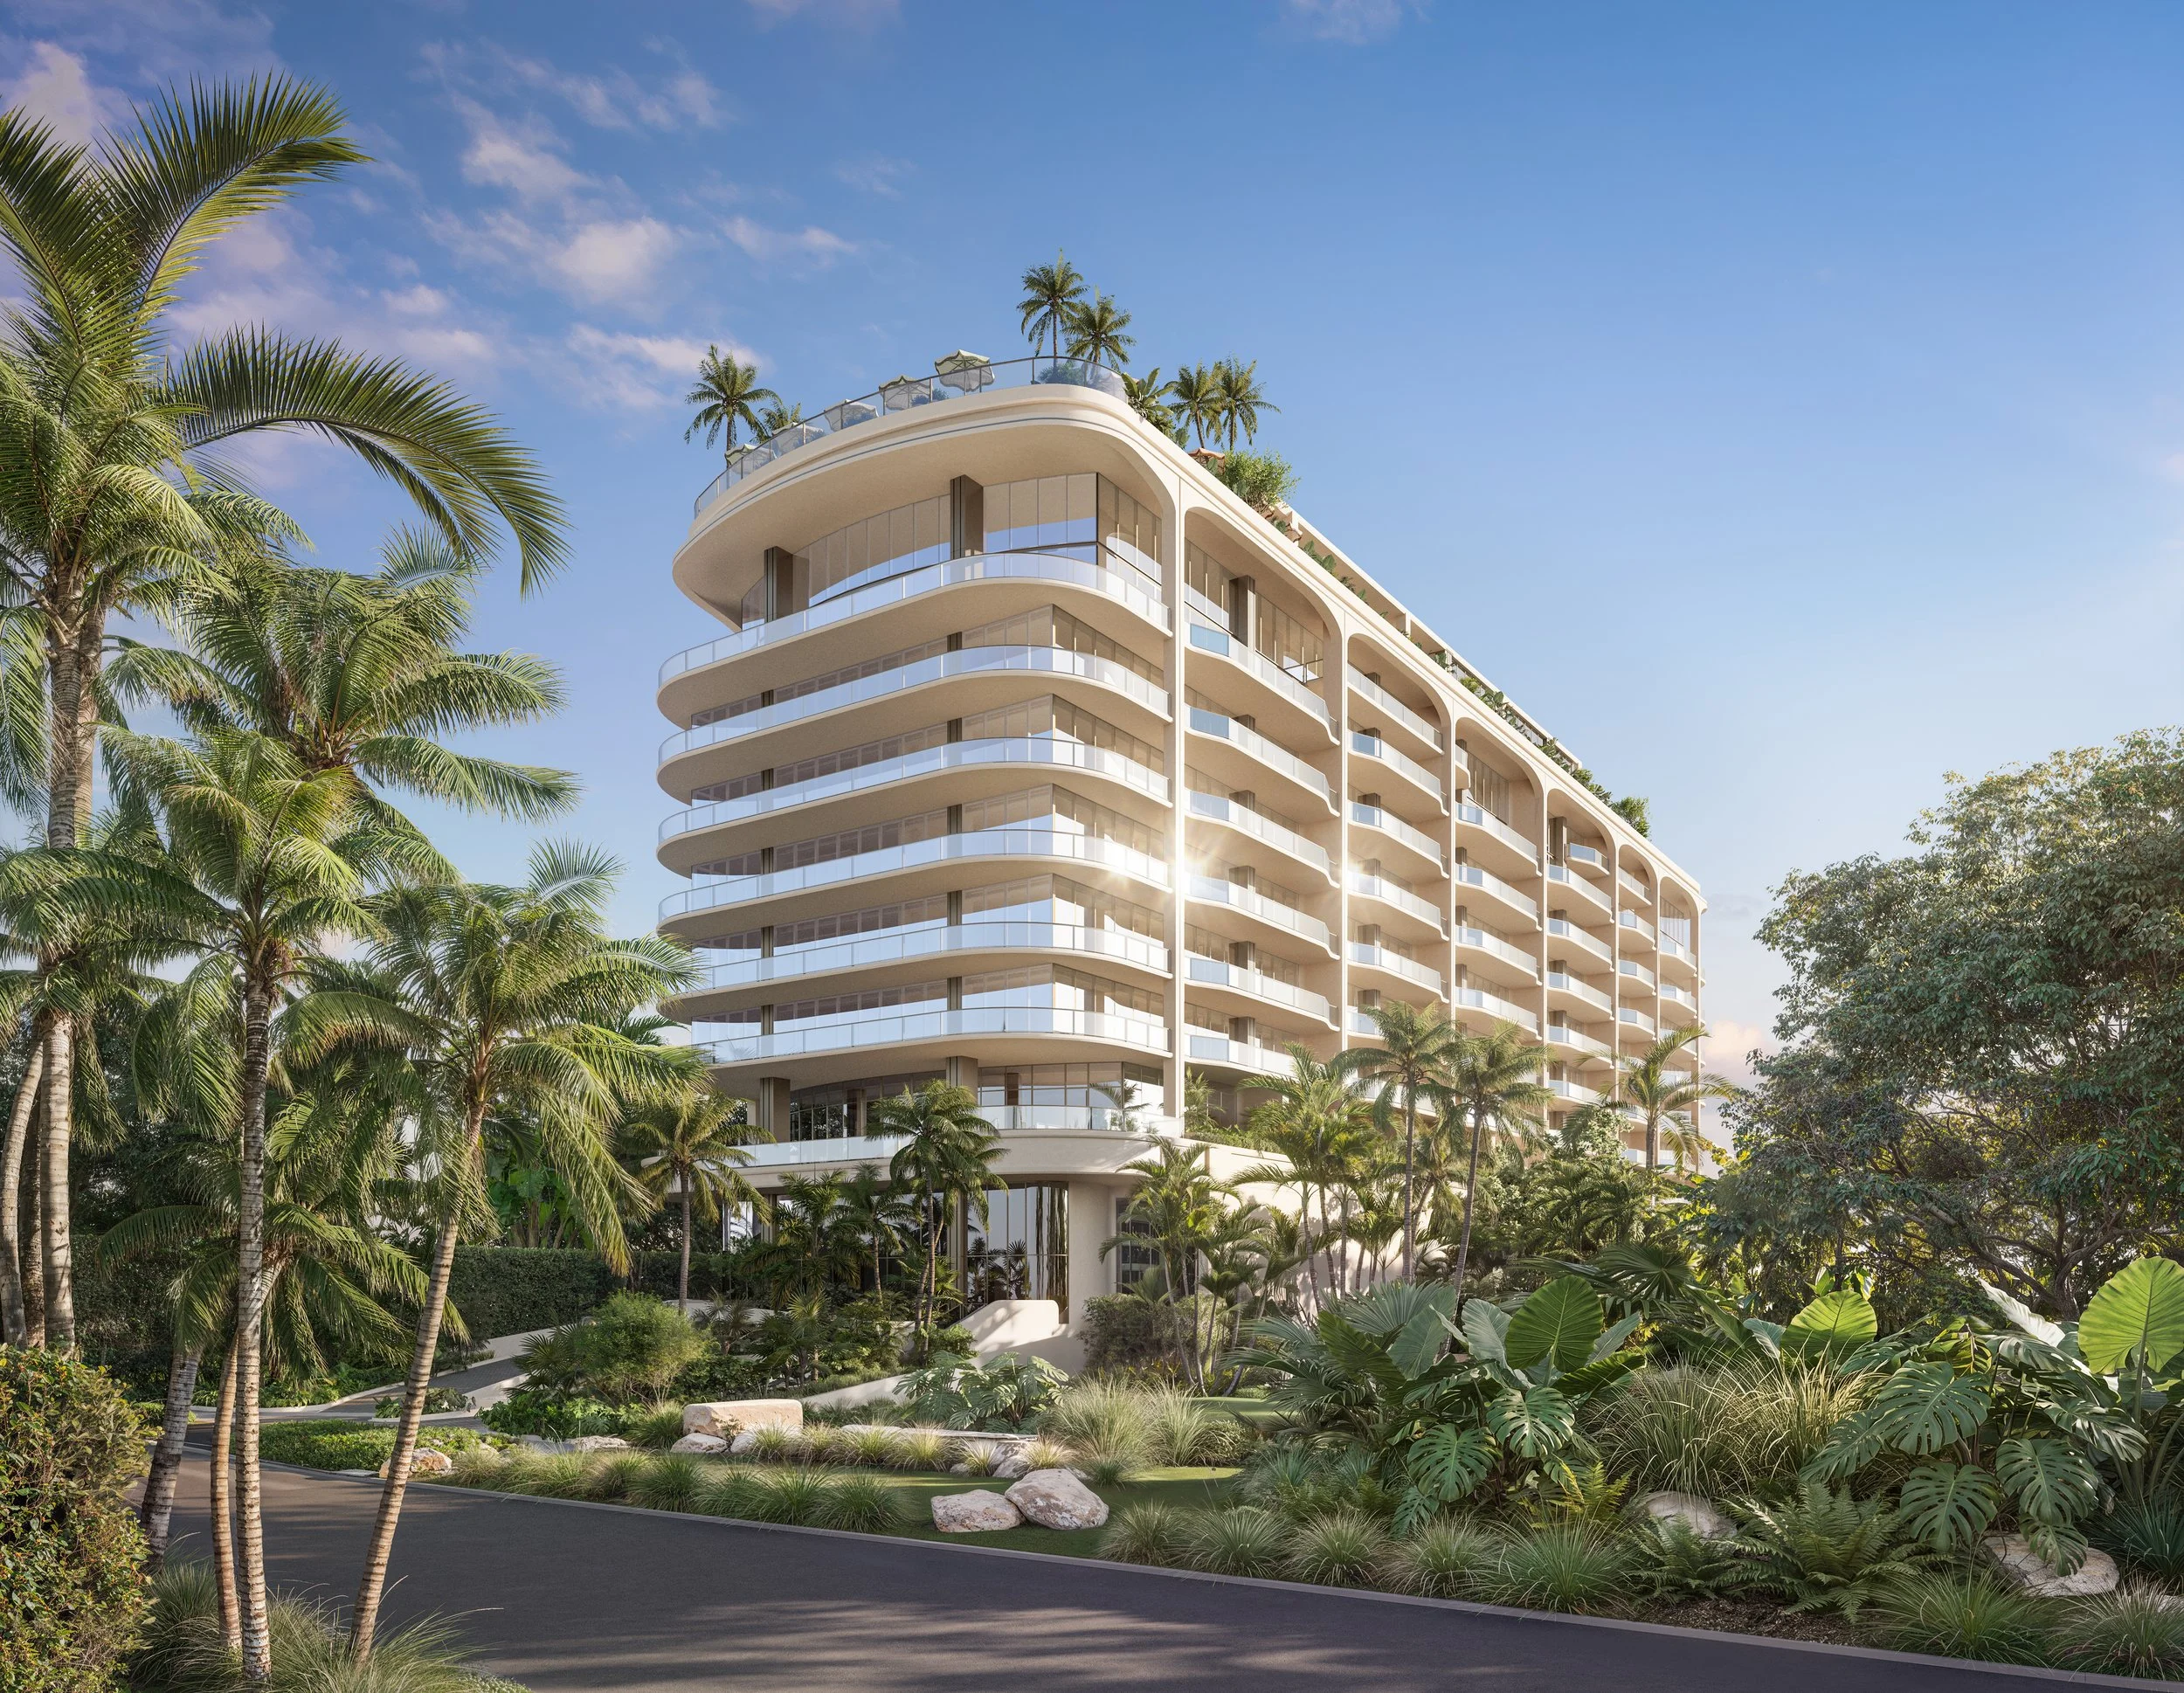
Ytech has unveiled 75 Broadway in Brickell: a 52-story collection of 106 homes from $3 million, designed by KPF with ACPV interiors and Enea landscapes. Completion is anticipated in late 2029.