
Douglas Elliman Releases Q3 2020 Florida Regions Market Reports For South Florida
Douglas Elliman has just released their Q3 2020 Market Reports for Florida regions, which were prepared in conjunction with Jonathan Miller of Miller Samuel INC. The reports have revealed that sales rose sharply higher year over year, rebounding quickly from the restraint of spring market activity at the onset of the COVID-19 crisis.
Douglas Elliman has just released their Q3 2020 Market Reports for Florida regions, which were prepared in conjunction with Jonathan Miller of Miller Samuel INC. The reports revealed that sales rose sharply higher year over year, rebounding quickly from the restraint of spring market activity at the onset of the COVID-19 crisis. Palm Beach has been one of the hottest markets in the United States as flight capital continues to pour in from the high-tax states such as New York and Connecticut. All three condo price trend indicators increased year over year for the fifth straight quarter in Palm Beach while single family sales nearly tripled from the year-ago quarter as listing inventory fell sharply. Coral Gables and Miami Beach also surged as sales and prices saw 5 year highs across much of South Florida.
BOCA RATON/HIGHLAND BEACH
Overview:
In a rebound from the prior quarter, condo and single family sales saw their largest annual rise in seven years
All single family price trend indicators rose year over year as sales saw its largest jump in nearly nine years
All luxury condo price trend indicators showed a substantial year over year increase
Key Trend Metrics (Year to Year)
Luxury Condo:
Median sales price rose 28.6% to $868,000
Average price per square foot increased by 12.2% to $414
Number of sales rose 14.3% to 88
Listing inventory declined by 1.5% to 405 units
Luxury Single Family:
Median sales price rose 14.3% to $2,550,000
Average price per square foot increased by 4.5% to $421
Number of sales rose 25.4% to 89
Listing inventory declined by 22% to 266 units
MIAMI BEACH/BARRIER ISLANDS
Overview:
Condo price trend indicators increased as sales and listing inventory edged higher
Overall single family price trend indicators set new records as sales surged year over year
Luxury condo price trend indicators jumped year over year, aided by a shift to larger sized sales
Key Trend Metrics (Year to Year)
Luxury Condo:
Median sales price rose 29.3% to $2,975,000
Average price per square foot increased by 18.9% to $1,262
Number of sales remained flat at 77
Listing inventory declined by 15.1% to 993 units
Luxury Single Family:
Median sales price rose 13.9% to $14,806,950
Average price per square foot increased by 12% to $1,787
Number of sales rose 63.6% to 18
Listing inventory declined by 27.1% to 102 units
MIAMI COASTAL MAINLAND
Overview:
Condo price trend indicators and sales moved higher as listing inventory slipped to a three-year low
Single family price trend indicators set new records as sales rose to their highest level in more than five years
Luxury condo price trend indicators increased year over year as listing inventory declined annually for the second time in three quarters
Key Trend Metrics (Year to Year)
Luxury Condo:
Median sales price rose 9.9% to $852,500
Average price per square foot increased by 6.9% to $508
Number of sales rose 1% to 200
Listing inventory declined by 15.1% to 2,398 units
Luxury Single Family:
Median sales price rose 31.1% to $1,940,000
Average price per square foot increased by 29.3% to $600
Number of sales rose 9.5% to 230
Listing inventory declined by 32.1% to 694 units
CORAL GABLES
Overview:
Single family sales surged and listing inventory fell from the prior year quarter as the lockdown ended
Condo listing inventory declined annually for the fifth consecutive quarter
Luxury single family listing inventory declined sharply year over year for five straight quarters
Key Trend Metrics (Year to Year)
Luxury Condo:
Median sales price fell 41.4% to $962,500
Average price per square foot decreased by 28.7% to $407
Number of sales slipped 11.1% to 8
Listing inventory inclined by 125% to 72 units
Luxury Single Family:
Median sales price rose 26.9% to $4,500,000
Average price per square foot decreased by 6.4% to $989
Number of sales rose 53.3% to 23
Listing inventory declined by 21.1% to 101
DELRAY BEACH
Overview:
Single family sales increased at their highest year over year rate in five years
Condo sales reached their highest third-quarter total in twenty-two years of tracking
Both single family and condo luxury listing inventory fell sharply from the prior year total
Key Trend Metrics (Year to Year)
Luxury Condo:
Median sales price rose 41.1% to $604,500
Average price per square foot increased by 21.4% to $409
Number of sales rose 14.3% to 72
Listing inventory declined by 25.2% to 169 units
Luxury Single Family:
Median sales price rose 40.8% to $2,500,000
Average price per square foot increased by 5.7% to $515
Number of sales rose 22.9% to 43
Listing inventory declined by 45.6% to 99 units
FORT LAUDERDALE
Overview:
All condo price trend indicators rose year over year as the number of sales jumped
Single family sales surged, and listing inventory fell sharply from the prior-year quarter
Single family median sales price increased annually for the eighth consecutive quarter
Key Trend Metrics (Year to Year)
Luxury Condo:
Median sales price rose 0.9% to $1,155,000
Average price per square foot increased by 1.4% to $509
Number of sales rose 7.8% to 55
Listing inventory declined by 0.5% to 379 units
Luxury Single Family:
Median sales price rose 7.7% to $2,275,000
Average price per square foot remained flat at $580
Number of sales rose 17.6% to 60
Listing inventory declined by 21.5% to 256 units
JUPITER/PALM BEACH GARDENS
Jupiter Overview:
Single family sales jumped year over year as listing inventory dropped sharply
The most third-quarter condo sales in fifteen years
Palm Beach Gardens Overview:
The most third quarter single family sales in fifteen years
Condo listing inventory declined annually for the sixth straight quarter
Key Trend Metrics (Year to Year)
Luxury Condo:
Median sales price fell 7.1% to $657,500
Average price per square foot decreased by 16.4% to $320
Number of sales rose 27.3% to 28
Listing inventory inclined by 26.3% to 72 units
Luxury Single Family:
Median sales price rose 121% to $3,550,000
Average price per square foot increased by 37% to $678
Number of sales rose 14.7% to 39
Listing inventory declined by 38.7% to 76 units
PALM BEACH
Overview:
All three condo price trend indicators increased year over year for the fifth straight quarter
Single family sales nearly tripled from the year-ago quarter as listing inventory fell sharply
Luxury listing inventory fell significantly year over year for the third consecutive quarter
Key Trend Metrics (Year to Year)
Luxury Condo + Single Family:
Median sales price declined 39.3% to $10,000,000
Average price per square foot increased by 20% to $1,906
Number of sales rose 87.5% to 15
Listing inventory declined by 65.3% to 26 units
WELLINGTON
Overview:
Condo sales surged annually at their highest rate in eleven years as listing inventory edged higher for the second straight quarter
Single family median sales price rose annually for the twelfth straight quarter as listing inventory dropped sharply
Luxury condo median sales price more than doubled year over year as listing inventory saw a significant annual decline
Key Trend Metrics (Year to Year)
Luxury Condo:
Median sales price rose 102.4% to $840,000
Average price per square foot increased by 61.1% to $427
Number of sales rose 28.6% to 9
Listing inventory declined by 42.1% to 22 units
Luxury Single Family:
Median sales price rose 28.1% to $1.825,000
Average price per square foot increased by 13.1% to $553
Number of sales rose 20.7% to 35
Listing inventory declined by 9.3% to 194 units
WEST PALM BEACH
Overview:
Condo median sales price has risen each quarter on a year over year for more than nine years
Single family listing inventory has fallen at a rising year over year rate for five consecutive quarters
Luxury condo listing inventory has posted large annual gains for three of the past four quarters
Key Trend Metrics (Year to Year)
Luxury Condo:
Median sales price declined 49.1% to $407,500
Average price per square foot decreased by 62% to $452
Number of sales rose 7.5% to 72
Listing inventory inclined by 85.5% to 308 units
Luxury Single Family:
Median sales price rose 48.7% to $1,297,250
Average price per square foot increased by 32.1% to $412
Number of sales rose 28% to 64
Listing inventory declined by 14.3% to 132 units
Douglas Elliman Releases Q2 2020 South Florida Market Reports
Douglas Elliman has just released their Q2 2020 Market Reports for South Florida, which were prepared by Miller Samuel, a leading independent appraisal firm. The reports, which cover the areas such as Boca Raton, Delray Beach, Fort Lauderdale, Miami Beach, and the Miami Coastal Mainland, have revealed that the COVID-19 market shutdown during much of the second quarter caused sales to fall sharply in South Florida.
Douglas Elliman has just released their Q2 2020 Market Reports for South Florida, which were prepared by Miller Samuel, a leading independent appraisal firm. The reports, which cover the areas such as Boca Raton, Delray Beach, Fort Lauderdale, Miami Beach, and the Miami Coastal Mainland, have revealed that the COVID-19 market shutdown during much of the second quarter caused sales to fall sharply in South Florida, despite the strength of the market in the first quarter.
Miami Beach/Barrier Islands
Overview:
Condo price trend indicators moved higher as the number of sales dropped during the shutdown
Single-family price trend indicators continued to decline along with sales and listing inventory year over year
Luxury condo price trend indicators pressed higher as listing inventory showed a slight gain
Key Trend Metrics (Year to Year)
Overall:
Median sales price rose 10.3% to $480,000
Average price per square foot edged up 6.1% to $659
Number of sales dropped 34.9% to 501
Listing inventory decreased by 0.5% to 6,393 units
Luxury Condo:
Median sales price increased by 11.6% to $2,850,000
Average price per square foot rose 4.8% to $1,231
Number of sales fell 37.7% to 43
Listing inventory slipped 3.0% to 1,095 units
Luxury Single Family:
Median sales price decreased by 22.6% to $7,200,000
Average price per square foot jumped 17.2% to $1,388
Number of sales had no change at 9
Listing inventory increased by 25.4% to 173 units
Miami Coastal Mainland
Overview:
Condo listing inventory and number of sales declined, median sales price reached a new record
Single-family median sales price rose to a new record as both sales and listing inventory fell sharply
Luxury condo price trend indicators showed mixed results as the number of sales saw a significant decline
Key Trend Metrics (Year to Year)
Overall:
Median sales price rose 4.4% to $355,000
Average price per square foot increased by 5.1% to $289
Number of sales dropped 20.1% to 2,672
Listing inventory declined by 7.8% to 9,699 units
Luxury Condo:
Median sales price fell 14.0% to $805,000
Average price per square foot dropped 0.6% to $489
Number of sales declined by 33.5% to 115
Listing inventory increased by 13.4% to 2,508 units
Luxury Single Family:
Median sales price fell 11.9% to $1,410,000
Average price per square foot rose 25.5% to $557
Number of sales decreased by 6.1% to 153
Listing inventory dropped 1.1% to 915 units
Fort Lauderdale
Overview:
Condo sales dropped at the highest rate in more than thirteen years as all price trend indicators rose annually
Single-family sales fell at the largest rate since 2007 as median sales price stabilized
Luxury condo price trend indicators increased above year-ago levels at their most robust rate in six quarters
Key Trend Metrics (Year to Year)
Luxury Condo:
Median sales price rose 6.0% to $1,282,330
Average price per square foot increased by 5.2% to $587
Number of sales slipped 27.5% to 37
Listing inventory declined by 16.5% to 283 units
Luxury Single Family:
Median sales price dropped 22.5% to $2,500,000
Average price per square foot decreased by 23.9% to $596
Number of sales fell 20.5% to 35
Listing inventory declined by 12.5% to 259 units
Boca Raton/Highland Beach
Overall:
Condo sales declined year over year at its highest rate in 13 years as median sales price increased
Single-family sales declined year over year at its highest rate in 13 years as median sales price surged
Luxury condo median sales price declined while luxury single-family median sales price rose
Key Trend Metrics (Year to Year)
Luxury Condo:
Median sales price fell 23.0% to $885,000
Average price per square foot slipped 13.0% to $461
Number of sales declined by 21.2% to 52
Listing inventory surged 11.2% to 328
Luxury Single Family:
Median sales price dropped 13.1% to $2,215,000
Average price per square foot decreased by 12.6% to $382
Number of sales slipped 12.1% to 51
Listing inventory declined by 0.3% to 304 units
Delray Beach
Overview:
Single-family sales declined at the largest year over year rate in over thirteen years as the market paused
Condo median sales price was unchanged year over year, the eighteenth straight quarter without a decline
Luxury single-family listing inventory declined annually as luxury condo listing inventory saw a large gain
Key Trend Metrics (Year to Year)
Luxury Condo:
Median sales price decreased by 6.7% to $810,500
Average price per square foot rose 6.7% to $445
Number of sales slipped 24.6% to 46
Listing inventory surged 20.9% to 208 units
Luxury Single Family:
Median sales price dropped 0.6% to $2,087,500
Average price per square foot fell 13.7% to $504
Number of sales declined by 15.2% to 28
Listing inventory increased by 5.7% to 130
Wellington
Overview:
Condo sales declined sharply as median sales price increased year over year for the fifteenth straight quarter
Single-family listing inventory and sales showed sharp declines from prior year levels
Luxury listing inventory across both property types jumped from prior year
Key Trend Metrics (Year to Year)
Luxury Condo:
Median sales price fell 19.9% to $585,000
Average price per square foot dropped 10.1% to $313
Number of sales increased by 16.7% to 7
Listing inventory rose 72.2% to 62 units
Luxury Single Family:
Median sales price declined 24.3% to $1,135,000
Average price per square foot slipped 34.9% to $426
Number of sales jumped 15.0% to 23
Listing inventory increased by 9.2% to 226 units
Palm Beach
Overview:
Condo price trend indicators jumped as the largest average sales size in two years skewed them higher
Single-family listing inventory fell by the largest rate in seven years of tracking
Luxury listing inventory showed a substantial drop as price trend indicators surged year over year
Key Trend Metrics (Year to Year)
Luxury Condo and Single Family:
Median sales price surged 33.1% to $14,000,000
Average price per square foot rose 18.4% to $2,180
Number of sales dropped 30.8% to 9
Listing inventory declined by 65.6% to 22 units
Jupiter/Palm Beach Gardens
Jupiter Overview:
Single-family sales price trend indicators and sales continued to show substantial year over year growth
Condo price trend indicators rose year over year for the fourth straight quarter
Palm Beach Gardens Overview:
Single-family sales fell at their most significant rate in fourteen years
Condo price trend indicators rose year over year for the third consecutive quarter
Key Trend Metrics (Year to Year)
Jupiter Luxury Condo:
Median sales price decreased by 19.9% to $733,000
Average price per square foot dropped 10.6% to $404
Number of sales fell 13.6% to 19
Listing inventory increased by 16.7% to 63 units
Jupiter Luxury Single Family:
Median sales price declined by 11.5% to $2,300,000
Average price per square foot decreased by 2.9% to $647
Number of sales fell 7.4% to 25
Listing inventory dropped 15.3% to 111 units
Palm Beach Gardens Luxury Condo:
Median sales price fell 26.7% to $440,000
Average price per square foot dropped 24.1% to $239
Number of sales declined by 19.0% to 17
Listing inventory surged 67.4% to 72 units
Palm Beach Gardens Luxury Single Family:
Median sales price jumped 21.2% to $2,347,500
Average price per square foot rose 8.7% to $501
Number of sales decreased by 23.1% to 20
Listing inventory dropped 27.5% to 95 units
By Isabella Zimmermann
Douglas Elliman Releases Q1 2020 South Florida Market Reports
Douglas Elliman has just released their Q1 2020 Market Reports in South Florida. It reveals noticeably stronger results for listing inventory growth in the first two and a half months of the quarter until market awareness of COVID-19 occurred in mid-March, which slowed growth across South Florida in areas such as Boca Raton, Delray Beach, Fort Lauderdale, Miami Beach, and the Miami Coastal Mainland.
Douglas Elliman in conjunction with Miller Samuel, a leading independent appraisal firm, has just released their Q1 2020 Market Reports for South Florida. It reveals noticeably stronger results for listing inventory growth in the first two and a half months of the quarter until market awareness of COVID-19 occurred in mid-March, which slowed growth across South Florida in areas such as Boca Raton, Delray Beach, Fort Lauderdale, Miami Beach, and the Miami Coastal Mainland. The report reflects pre-pandemic strengths in the South Florida market and even an increase in some areas’ average sales price and number of sales compared to the previous quarter, especially in Palm Beach, which saw a 46.7% rise in number of closed condo sales and had the most significant year over year increase in single-family sales in six years.
“The same fundamentals that have made Florida attractive, and have supported the relatively long-term stability in our markets over the past few years, all remained in place during the first quarter as much as they will once we get past this pandemic. Overall Q1 reflected the pre-pandemic strengths we have been enjoying, with most markets realizing steady sales volume and pricing. As we come out of this global crisis, I believe that the desirability for Florida’s lifestyle coupled with tax reform, and the maturation of our markets, will continue to support the trajectory the markets were on prior to COVID-19,” said Jay Phillip Parker, CEO of Douglas Elliman Florida brokerage.
Miami Beach/Barrier Islands
Overview:
· Overall listing inventory declined year over year for condos and single-family properties
· Condo price trend indicators declined from the year-ago quarter
· Single-family price trend indicators declined annually, partially skewed by the decline in average sales size
· A sharp drop in average sales size for both luxury condos and luxury single-family properties skewed price trend indicators lower
Key Trend Metrics (Year to Year)
Overall:
· Median sales price slipped 1.1% to $435,000
· Average price per square foot decreased by 12.4% to $621
· Number of sales slipped by 0.4% to 769
· Listing inventory decreased by 4.5% to 6,425
Luxury Condo:
· Median sales price fell 20.8% to $2,553,000
· Average price per square foot decreased by 9.5% to $1,175
· Listing inventory rose 12.2% to 1,129 units
· Average square footage declined 13.8% to 3,429
Luxury Single Family:
· Median sales price fell 32.9% to $9,766,667
· Average price per square foot decreased by 22.3% to $1,184
· Listing inventory dropped 19.1% to 169 units
· Average square footage declined 13.6% to 8,249
Miami Coastal Mainland
Overview:
· Overall listing inventory declined sharply on a year over year basis for both condos and single-family properties
· Condo sales rose annually for the fourth straight quarter as price trend indicators pressed higher
· Single-family price trend indicators rose annually, and sales extended its year over year growth streak to the fourth straight quarter
· A significant decline in listing inventory on a year over year basis for both luxury condos and luxury single-family properties
Key Trend Metrics (Year to Year)
Overall:
· Median sales price rose 9% to $340,000
· Average sales price increased by 7.6% to $458,287
· Number of sales rose 7.7% to 3,343
· Listing inventory fell 14.1% to 10,519 units
Luxury Condo
· Median sales price increased by 20% to $1,195,545
· Average price per square foot rose 5.1% to $492
· Listing inventory declined 19.8% to 2,212 units
· Average square footage increased by 12.9% to 2,430
Luxury Single Family
· Median sales price rose 13.7% to $1,600,000
· Average price per square foot edged up 1.1% to $444
· Listing inventory fell 24.4% to 925 units
· Average square footage slipped 3.3% to 4,037
Fort Lauderdale
Overview:
· Condo price trend indicators pressed higher as sales slipped year over year
· Single-family sales and price trend indicators posted large annual gains
· Luxury condo price trend indicators showed mixed year over year results
· Luxury single-family price trend indicators surged, skewed by large increase in average sales size
Key Trend Metrics (Year to Year)
Luxury Condo:
· Median sales price slipped 1.3% to $1,210,000
· Average price per square foot edged up 1.3% to $558
· Listing inventory decreased by 2.6% to 339 units
· Average square footage declined 3.6% to 2,604
Luxury Single Family:
· Median sales price jumped 44% to $3,225,000
· Average price per square foot rose 47.7% to $783
· Listing inventory fell 25.3% to 296 units
· Average square footage rose 17% to 5,778
Boca Raton/Highland Beach
Overall:
· Condo listing inventory fell year over year for sixth straight quarters with the most significant decline in the current quarter
· Single-family listing inventory declined annually over the past four quarters at a rising rate
· Luxury condo and luxury single-family inventory fell short of year-ago levels
Key Trend Metrics (Year to Year)
Luxury Condo:
· Median sales price slipped 0.3% to $900,000
· Average price per square foot decreased by 0.2% to $465
· Listing inventory fell 15.6% to 260 units
· Average square footage declined by 4.8% to 2,666
Luxury Single Family
· Median sales price fell 10.3% to $1,895,000
· Average price per square foot rose 1.2% to $407
· Listing inventory fell 16.9% to 339 units
· Average square footage declined 0.4% to 7,267
Delray Beach
Overview:
· Single-family median sales price hasn’t shown a year over year decline in four quarters
· Condo listings fell annually for four straight quarters
· Luxury single-family price trend indicators showed mixed results
· Luxury condo price trend indicators showed substantial annual gains, partially aided by the increase in sales size
Key Trend Metrics (Year to Year)
Luxury Condo:
· Median sales price jumped 40.3% to $754,000
· Average price per square foot rose 48.9% to $530
· Listing inventory fell 36.3% to 163 units
· Average square footage increased by 2.4% to 1,827
Luxury Single Family:
· Median sales price fell 19.6% to $1,400,000
· Average price per square foot rose 5.5% to $439
· Listing inventory declined 7.1% to 91 units
· Average square footage declined 1.8% to 4,781
Wellington
Overview:
· Condo price trend indicators and sales rose as listing inventory declined from the prior year
· Single-family sales and price trend indicators moved higher year over year as listing inventory dropped sharply
· Luxury price trend indicators for both property types showed mixed results
Key Trend Metrics (Year to Year)
Luxury Condo:
· Median sales price rose 22% to $730,000
· Average price per square foot decreased by 3.3% to $348
· Listing inventory increased by 9.1% to 36 units
· Average square footage declined 10.9% to 2,038
Luxury Single Family:
· Median sales price fell 45.5% to $1,500,000
· Average price per square foot rose 18.1% to $654
· Listing inventory declined 12.3% to 207 units
· Average square footage declined 21.9% to 4,465
Palm Beach
Overview:
· Listing inventory for condos, single-family properties and luxury fell sharply from year-ago levels
· All three condo price trend indicators rose year over year for the third straight quarter
· The most significant year over year increase in single-family sales in six years
· All three price trend indicators for the luxury market were skewed higher year over year by the surge in average sales size
Key Trend Metrics (Year to Year)
Luxury Condo and Single Family:
· Median sales price surged 48.1% to $10,517,500
· Average price per square foot rose 12.2% to $1,841
· Listing inventory dropped 49.6% to 64 units
· Average square footage surged 49.4% to 7,344
Jupiter/Palm Beach Gardens
Jupiter Overview:
· Single-family sales price trend indicators and sales showed substantial annual gains
· Condo sales declined as price trend indicators press higher from year-ago levels
Palm Beach Gardens Overview:
· Single-family sales price trend indicators were mixed as sales jumped year over year
· Condo sales and price trend indicators showed robust annual increases
Key Trend Metrics (Year to Year)
Jupiter Luxury Condo:
· Median sales price slipped 5.4% to $915,000
· Average price per square foot rose 2.7% to $452
· Listing inventory rose 17.4% to 54 units
· Average square footage edged up 0.3% to 2,378
Jupiter Luxury Single Family:
· Median sales price rose 8.5% to $2,600,000
· Average price per square foot increased by 9.2% to $666
· Listing inventory rose 7.4% to 131 units
· Average square footage increased by 17.1% to 5,699
Palm Beach Gardens Luxury Condo:
· Median sales price surged 39.5% to $600,000
· Average price per square foot rose 46.5% to $315
· Listing inventory fell 44.2% to 43 units
· Average square footage increased by 18.6% to 2,588
Palm Beach Gardens Luxury Single Family:
· Median sales price fell 22.6% to $1,937,500
· Average price per square foot decreased by 1.5% to $461
· Listing inventory declined 12.1% to 131 units
· Average square footage declined 18.5% to 4,837
Article by Isabella Zimmermann
Douglas Elliman Releases Q1 2019 Market Reports For South Florida
Douglas Elliman released their Q1 2019 Market Reports in South Florida.The South Florida Market reports showed price trends generally edging higher, although sales slipped and inventory slightly increased this quarter. The markets included Miami Beach and Barrier Islands,Fort Lauderdale , Boca Raton, Highland Beach, Delray Beach, Wellington, Palm Beach, Jupiter, and Palm Beach Gardens.
Douglas Elliman released their Q1 2019 Market Reports in South Florida.The South Florida Market reports showed price trends generally edging higher, although sales slipped and inventory slightly increased this quarter. The markets included Miami Beach and Barrier Islands,Fort Lauderdale , Boca Raton, Highland Beach, Delray Beach, Wellington, Palm Beach, Jupiter, and Palm Beach Gardens.
Miami Beach/Barrier Islands
Overview:
Overall price trend indicators increased than year ago levels
Marketing time jumped as older inventory was sold
Condo median sales price remained unchanged
All single family price trend indicators increased as sales decreased
Luxury condo inventory slipped
Luxury single family price trend indicators surged
Key Trend Metrics(Year to Year):
Overall:
Median sales price rose 2.3% to $440,000
Average sales price increased 11.6% to $1,129,317
Number of sales slipped 2% to 772
Days on market was 145, up from 80
Listing discount was 10.6%, up from 10.4%
Listing inventory slipped 0.3% to 6,726
Luxury Condo:
Median sales price rose 12.7% to $3,225,000
Average price per square foot decreased 11% to $1,299
Days on market was 70, down from 72
Listing discount was 12.7%, up from 11.5%
Listing inventory declined 6.6% to 1,006 units
Entry threshold began at $1,864,000, up from 1,750,000
Luxury Single Family:
Median sales price surged 61% to $10,100,000
Average price per square foot rose 2.6% to $1,524
Days on market was 352 up from 141
Listing discount was 12.1%, down from 17.9%
Listing inventory fell 38.5% to 152 units
Entry threshold began at $7,250,000, up 70.6%
Miami Coastal Mainland
Overview:
Median sales price rose year over year for the eighteenth consecutive quarter
Sales declined annually for the first time in three quarters
Listing inventory trended higher for the fourth straight quarter
Luxury condo listing inventory declined annually for the fourth consecutive quarter
Luxury condo price trend indicators were mixed year over year as marketing time expanded
Luxury single family price trend indicators slipped as marketing time expanded
Key Trend Metrics(Year to Year):
Overall:
Median sales price increased 0.6% to $320,000
Average sales price slipped 2.2% to $425,740
Number of sales declined 7.5% to 3,104
Days on market was 91 up from 51
Listing discount was 5.7%, down from 5.9%
Listing inventory rose 6.9% to 12,247 units
Luxury Condo:
Median sales price slipped 6.9% to $780,000
Average price per square foot rose 4.9% to $468
Days on market was 160 days, down from 167
Listing discount was 7.2%, down from 7.4%
Listing inventory declined 0.3% to 2,759
Entry threshold began at $580,000, up 9.4%
Luxury Single Family:
Median sales price slipped 0.5% to $1,407,500
Average price per square foot slipped 0.9% to $439
Days on market was 133 days up from 76
Listing discount was 8.9%, up from 8.8%
Listing inventory rose 14.7% to 1,223 units
Entry threshold began at $880,000, down 4.6%
Fort Lauderdale
Overview:
Condo price trend indicators slid year over year with decline in average sales size
Condo sales declined annually for the first time in five quarters
Single-family price trend indicators were mixed as inventory expanded annually for the fifth straight quarter
Luxury condo pending sales signed in the quarter surged
Single family luxury median and average sales price moved higher as marketing time stabilized
Key Trend Metrics(Year to Year):
Luxury Condo:
Median sales price decreased 6.2% to $1,226,000
Average price per square foot rose 0.5% to $619
Days on market was 52, down 8.8%
Listing discount was 7.6%, up from 6.7%
Listing inventory rose 20.4% to 348 units
Entry threshold began at $875,000 down 7.9%
Luxury Single Family:
Median sales price rose 8% to $2,240,000
Average price per square foot slipped 2.6% to $530
Days on market was 163, unchanged
Listing discount was 14.9%, up from 8.1%
Listing inventory rose 19.6% to 396 units
Entry threshold began at $1,365,000, down 6.5%
Boca Raton/Highland Beach
Overview:
Condo & single family price trend indicators rose year over as sales slipped for the first time in three quarters
Condo & single family price trend indicators saw larger growth at the higher end of the market
Condo listing inventory fell annually for the second straight quarter
Luxury condo price trends surged year over year partially due to jump in average sales size
Key Trend Metrics(Year to Year):
Luxury Condo:
Median sales price jumped 48.3% to $1,175,000
Average price per square foot rose 39.2% to $522
Days on market was 146 days, up from 116
Listing discount was 8.2%, up from 7.3%
Listing inventory declined 21.4% to 313
Entry threshold began at $665,000, up 26.7%
Luxury Single Family:
Median sales price declined 14.9% to $1,830,000
Average price per square foot rose 9.1% to $455
Days on market was 136 days, up from 134
Listing discount was 9.4%, down from 9.4%
Delray Beach
Overview:
Single family sales slipped for the first time in six quarters as listing inventory expanded for four quarters
Condo price trend indicators haven’t declined in thirteen straight quarters
Luxury single family price trend indicators skewed lower by decline in average sales size
Key Trend Metrics(Year to Year)
Luxury Condo:
Median sales price declined 26.8% to $510,000
Days on market was 111, up from 88
Listing discount was 5.4%, down from 6.6%
Entry threshold began at $385,000, unchanged
Luxury Single Family:
Median sales price declined 1.4% to $2,045,250
Days on market was 143, up from 126
Listing discount was 9.7%, up from 8.7%
Entry threshold began at $1,298,000, down 1.6%
Wellington
Overview:
Condo median sales price increased annually for the tenth straight quarter
Condo inventory expanded year over year for the fourth consecutive quarter
Single-family price trend indicators all rose year over year for the fourth consecutive quarter
Single-family sales declined annually for the fourth time in the past five quarters
Luxury condo and single-family price trend indicators surged due to significant shift to larger average sales size
Key Trend Metrics(Year to Year)
Luxury Condo:
Median sales price surged 58.5% to $598,500
Average square footage jumped 14.6% to 2,288
Days on market was 154, down from 157
Listing discount was 1.8%, down from 3.7%
Listing inventory fell 46.8% to 33
Entry threshold began at $415,000, up 22.1%
Luxury Single Family:
Median sales price jumped 79.9% to $2,752,500
Average square footage surged 42.7% to 5,717
Days on market was 184, down from 262
Listing discount was 14.2%, up from 9.5%
Listing inventory declined 6.3% to 236
Entry threshold began at $885,000 down 1.1%
Palm Beach
Overview:
Condos sales rose annually for the fifth consecutive quarter to the second highest market share recorded
Most first quarter condo sales in four years while inventory increase annual for the fourth time in five quarters
Single family price trends showed mixed results as sales fell to their lowest first quarter total in seven years
Luxury average sales size fell sharply as the luxury price threshold fell annually for the fourth straight quarter
Key Trend Metrics(Year to Year)
Luxury Condo and Single Family:
Median sales price declined 29.2% to $7,100,000
Average sales size dropped 25.1% to 4,915 square feet
Average price per square foot fell 21.1% to $1,641
Days on market was 106, down from 122
Listing discount was 8.1%, down from 14.6%
Listing inventory jumped 27% to 127
Entry threshold began at $5,100,000, down 6%
Jupiter/Palm Beach Gardens
Jupiter Overview:
Single-family median sales price moved higher for the second straight month
Condo sales rose year over year for the third consecutive quarter
Palm Beach Gardens Overview:
Single-family sales slipped for the third time in four quarters as all price indicators rose
Condo median price slipped year over year for the first time in 27 quarters
Key Trend Metrics(Year to Year)
Jupiter Luxury Condo:
Median sales price rose 7% to $305,000
Days on market was 65, up from 46
Listing discount was 5.3%, up from 5.1%
Listing inventory rose 3.1% to 328
Jupiter Single Family:
Median sales price increase 6% to $530,000
Days on market was 71, down from 77
Listing discount was 5.4%, up from 6.5%
Listing inventory rose 11.1% to 481
Palm Beach Gardens Luxury Condo:
Median sales price slipped 2.1% to $235,000
Days on market was 71, up from 49
Listing discount was 4.1%, down from 4.5%
Listing inventory jumped 16.9% to 277
Palm Beach Gardens Single Family:
Median sales price increased 8.2% to $499,500
Days on market was 89, up from 83
Listing discount was 6.9%, down from 7.9%
Listing inventory rose 3% to 556
Article by Stephanie Warren
Douglas Elliman Releases Q4 Market Reports For South Florida
Douglas Elliman has released their Q4 Market Reports for South Florida, produced in conjunction with Miller Samuel a leading independent appraisal firm. The South Florida Market continued to show power in prices, continuing to increase in both the luxury and overall markets across nearly all markets including Miami Beach and Barrier Islands, Fort Lauderdale, etc.
Douglas Elliman has released their Q4 Market Reports for South Florida, produced in conjunction with Miller Samuel a leading independent appraisal firm. The South Florida Market continued to show power in prices, continuing to increase in both the luxury and overall markets across nearly all markets including Miami Beach and Barrier Islands, Fort Lauderdale, Boca Raton, DelRay Beach, Wellington, Palm Beach, Jupiter and Palm Beach Gardens.
MIAMI BEACH/BARRIER ISLANDS
Key Trend Metrics(Year Over Year)
Overview:
Single family sales surged as condo sales declined after a large burst of activity on the prior quarter
Condo price trend indicators declined from year ago levels, consistent with drop in average sales size
Luxury condo price trend indicators declined at same rate as average sales size
Luxury single-family sales size rose sharply driving price trend indicators higher
Luxury condo inventory increased as luxury single family inventory declined
Marketing time expanded as older listings were absorbed as negotiability expanded
Key Trend Metrics(Year Over Year)
Overall
Median sales price slipped 6.7% to $378,750
Average sales price increased 0.3% to $888,424
Number of sales slipped 10.4% to 678
Days on market was 146, up from 73
Listing discount was 10.9%, up from 810%
Listing inventory increased 3.8% to 6,668
Luxury Condo
Median sales price declined to $2,200,000
Average price per square foot decreased 13.5% to $1,047
Days on market was 222, up from 92
Listing discount was 12.6%, up from 11.3%
Listing inventory rose 20.5% to 1,459 units
Entry threshold began at $1,305,000
Luxury Single Family
Median sales price surged 33.3% to $8,000,000
Average price per square foot jumped 40.3% to $1,494
Days on market was 349, up from 170
Listing discount was 16.7%, up from 16.4%
Listing inventory fell 6.2% to 183 units
Entry threshold began at $5,900,000, up from 15.7%
MIAMI COASTAL MAINLAND
Overview:
Overall price trend indicators and the number of sales continued to rise year over year
Overall sales and all price trend indicators were above the level seen in 2017
Listing inventory trended higher for the fourth consecutive month
Market share of purchases with conventional financing was the highest in the five years
Nearly all luxury condo and single-family price trend indicators continued to rise greater year over year
Luxury condo inventory declined as luxury single family inventory expanded
Key Trend Metrics(Year Over Year)
Overall:
Median sales price increased 5.9% to $320,000
Average sales price rose 7.2% to $445,007
Number of sales rose 10.6% to 3,518
Days on market was 81 up from 44
Listing discount was 5.6%, down from 5.7%
Listing inventory rose 20.9% to 12,071 units
Luxury Condo
Median sales price slipped 3.8% to $812,500
Average price per square foot rose 4% to $470
Days on market was 178 days, up from 155
Listing discount was 7.8%, down from 8.1%
Listing inventory declined 18.9% to 2,505
Entry threshold began at $610,000, up 27.1%
Luxury Single Family
Median sales price rose 6.7% to $1,387,500
Average price per square foot jumped 16.8% to $479
Days on market was 130 days up from 67
Listing discount was 8.5%, up from 8.4%
Listing inventory rose 12.6% to 1,111 units
Entry threshold began at $890,000, up 3.5%
Fort Lauderdale
Overview:
Condo sales rose above for the fourth consecutive quarter
Condo listing inventory rose for the first time in six quarters
Single family price trend indicators were mixed as condos moved higher
Condo luxury price trend indicators surged
Single family luxury price trend indicators showed mixed results as average sales size declined
Key Trend Metrics(Year Over Year)
Overall:
Luxury Condo
Median sales price increased 25.8% to $1,550,000
Average price per square foot rose 21.1% to $619
Days on market was 131, down 34.5%
Listing discount was 5.6%, down from 7.7%
Listing inventory fell 28.7% to 256 units
Entry threshold began at $1,095,000 up 41.3%
Luxury Single Family
Median sales price rose 7.4% to $2,125,000
Average price per square foot slipped 4% to $572
Days on market was 176, down from 190
Listing discount was 9.5%, down from 16.4%
Listing inventory declined 7.4% to 338 units
Entry threshold began at $1,500,000, up 22%
BOCA RATON
Overview:
Condo median sales price hasn’t seen a year over year decline in ten quarters
Sales for condos and single-families have increased year over year for two consecutive quarters
Luxury condo and luxury single family price trends moved higher, consistent with rise in sales size
Key Trend Metrics(Year Over Year)
Overall:
Luxury Condo
Median sales price rose 9.4% to $902,500
Average price per square foot rose 32.8% to $466
Days on market was 108 days, up from 101
Listing discount was 6.7%, down from 8.9%
Listing inventory declined 13.7% to 308
Entry threshold began at $590,000, up 9.6%
Luxury Single Family
Median sales price rose 5.6% to $2,112,500
Average price per square foot rose 5.8% to $402
Days on market was 187 days, down from 217
Listing discount was 9.7%, down from 12.5%
Listing inventory edged up 1.7% to 408
Entry threshold began at $1,286,200 up 0.7%
DELRAY BEACH
Overview:
Single-family sales and median sales price have been rising year over year for four consecutive quarters
Condo median sales price showed twelve consecutive quarters without a year over year decline
Luxury single family price per square foot moved higher as the other indicators were pulled down sharply by drop in sales size
Key Trend Metrics (Year Over Year)
Luxury Condo
Median sales price rose 14.5% to $537,500
Days on market was 102, up from 66
Listing discount was 6.9%, up from 4.9%
Entry threshold began at $325,000, down 1.5%
Luxury Single Family
Median sales price declined 10.9% to $1,741,250
Days on market was 156, up from 104
Listing discount was 5.9%, down from 10.4%
Entry threshold began at $1,150,000, down 3.4%
WELLINGTON
Overview:
Condo median sales price year over year for the tenth consecutive quarter
Condo sales rose annual for three of the last four quarters
All single-family price trend indicators increased year over year for the third consecutive quarter
Luxury condo price trend indicators pulled lower by sharp decline in average sales size while the opposite occurred for luxury single-family price trends
Key Trend Metrics(Year Over Year)
Luxury Condo
Median sales price slipped 1.8% to $665,000
Average square footage declined 18.3% to 1,878
Days on market was 77, down from 148
Listing discount was 4.5%, down from 8.2%
Listing inventory jumped 52.2% to 35
Entry threshold began at $435,000, down 17.9%
Luxury Single Family
Median sales price jumped 88.2% to $2,000,000
Average square footage rose 1.7% to 4,662
Days on market was 195, up from 115
Listing discount was 8.9%, up from 7.7%
Listing inventory declined 33.6% to 186
Entry threshold began at $1,010,000 up 47.4%
Palm Beach
Overview:
Condos continued to dominate with the highest sales share
Single family and luxury price trend indicators skewed significantly lower by the sharp decline in average sales size
Majority fourth quarter market wide sales in 5 years
Luxury inventory returned to more modest levels after limited availability over the past two years
Key Trend Metrics (Year Over Year)
Luxury Family And Single Condo
Median sales price declined 57.8% to $6,426,750
Average price per square foot fell 22.5% to $1,443
Average sales size dropped 52.1% to 4,515 square feet
Days on market was 100, down from 496
Listing discount was 9.1%, down from 18.3%
Listing inventory jumped 104.1% to 100
Entry threshold began at $4,250,000, down 59.9%
JUPITER / PALM BEACH GARDENS
Jupiter Overview:
Single family price trend indicators and sales moved higher
Condo sales and price trend indicators all rose for the third consecutive quarter
Palm Beach Gardens Overview:
Single-family price trend indicators showed double-digit gains as sales decreased
Condo sales slipped again as price trend indicators continued to rise
Key Trend Metrics (Year Over Year)
Jupiter Single Family
Median sales price jumped 15.4% to $525,000
Days on market was 70, up from 62
Listing discount was 5.8%, up from 5.6%
Listing inventory declined 5.7% to 413
Jupiter Condo
Median sales price rose 11.3% to $310,000
Days on market was 60, up from 59
Listing discount was 4.1%, down from 5.2%
Listing inventory rose 5.2% to 304
Palm Beach Gardens Single Family
Median sales price increased 10.6% to $470,000
Days on market was 82, unchanged
Listing discount was 7.8%, up from 6.6%
Listing inventory rose 5.2% to 527
Palm Beach Gardens Condo
Median sales price rose 2.1% to $240,000
Days on market was 52, up from 48
Listing discount was 3.9%, down from 4.6%
Listing inventory jumped 41.7% to 299
Article by Stephanie Warren
Douglas Elliman Releases Q2 Market Reports For South Florida As Pricing Continues To Rise
Douglas Elliman has released their Q2 Market Reports for South Florida, produced in conjunction with Miller Samuel, a leading independent appraisal firm. Despite the constant rumblings of a bubble or a crash, the South Florida market continued to show strength and prices continuing to push higher in both the luxury and overall markets across nearly all markets
Douglas Elliman has released their Q2 Market Reports for South Florida, produced in conjunction with Miller Samuel, a leading independent appraisal firm. Despite the constant rumblings of a bubble or a crash, the South Florida market continued to show strength and prices continuing to push higher in both the luxury and overall markets across nearly all markets including Miami Beach, Miami coastal mainland, Fort Lauderdale, Boca Raton, Delray Beach and Jupiter. The quarter also reflected the most sales in 3 years in both Miami Beach and Delray Beach. The general health of the market should remain strong as South Florida continues to be a haven for flight capital and population growth, matched with fast-growing world-class cities, a high quality of life and no state income tax.
Miami Beach & Barrier Islands
- Price trend indicators posted strong gains across the overall and luxury markets
- Number of sales and pending sales moved up from year ago levels
- Although listing inventory has been rising for more than four years the rate of growth has eased considerably in past year
- Overall days on market and listing discount expanded as older listing inventory was cleared from the market
- Most second quarter sales in three years
- Luxury condo average sales size surged and pending sales posted strong gains
- Luxury listing inventory slipped
Key Trend Metrics (Year Over Year)
Overall:
- Median sales price rose 7% to $438,000
- Average sales price increased 15.8% to $1,098,024
- Number of sales increased 10.7% to 1,025
- Days on market was 148, up from 139
- Listing discount was 11%, up from 9.7%
- Listing inventory increased 3.9% to 6,319
Luxury Condo:
- Median sales price surged 47.6% to $3,370,000
- Days on market was 196, up from 194
- Listing discount was 12.7%, up from 11.4%
- Listing inventory fell 20.3% to 959 units
- Entry threshold began at $1,900,000
Luxury Single Family:
- Median sales price jumped 34.5% to $10,760,000
- Days on market was 262, down from 292
- Listing discount was 16.5%, up from 14.5%
- Listing inventory jumped 32.3% to 209 units
- Entry threshold began at $4,950,000
Miami Coastal Mainland
- Overall conditions reflect rising prices, stable sales and modest inventory gains
- Median sales price increased year over year for the 15th consecutive quarter
- Highest market share of conventional financing in more than five years of recording
- One in four single family sales and half of condo sales were purchased with cash
- Number of sales well above the 5-year quarterly average
- Listing inventory edged higher for second quarter after six consecutive quarters of year over year declines
Key Trend Metrics (Year Over Year)
Overall:
- Median sales price increased 6.7% to $320,000
- Average sales price rose 8.8% to $456,591
- Number of sales fell 0.3% to 4,191
- Days on market was 86 up from 79
- Listing discount was 5.6%, up from 5.5%
- Listing inventory rose 2.7% to 11,184 units
Luxury Condo:
- Median sales price rose 6.4% to $814,951
- Days on market was 176 days, up from 169
- Listing discount was 8.1%, up from 7.7%
- Listing inventory declined 6.3% to 2,537
- Entry threshold began at $580,000
Luxury Single Family:
- Median sales price rose 6.7% to $1,600,000
- Days on market was 125 days down from 133
- Listing discount was 7.9%, up from 7.7%
- Listing inventory slipped 1.1% to 1,012 units
- Entry threshold began at $960,000
Fort Lauderdale
- Sharp price gains in the overall condo and single family markets
- All condo price indicators set new records
- Overall condo market showed a large burst in year over year sales in last two quarters
- Large gain in conventional financial market share for both property types
- Luxury listing inventory fell sharply across property types
Key Trend Metrics (Year over Year)
Luxury Condo:
- Median sales price increased 9.8% to $1,281,600
- Days on market was 81, up from 68
- Listing discount was 6.8%, up from 5.6%
- Listing inventory fell 31.8% to 255 units
- Entry threshold began at $975,000
Luxury Single Family:
- Median sales price rose 35% to $2,265,000
- Days on market was 167, up from 155
- Listing discount was 9.2%, up from 8.2%
- Listing inventory declined 15.6% to 298 units
- Entry threshold began at $1,500,000
Boca Raton
- Overall price trends for both condos and single families increased year over year
- Sales slipped an inventory edged higher for both property types from the year ago quarter
- Share rise in average sales size and price trend indicators for luxury condos
- Unlike overall market, listing inventory for luxury properties declined
- Luxury pending sales are up year over year
Key Trend Metrics (Year Over Year)
Luxury Condo:
- Median sales price rose 24.8% to $1,051,250
- Average sales price surged 31.3% to $1,394,111
- Days on market was 128 days, up 14.3%
- Listing discount was 8.3%, unchanged
- Listing inventory fell 21.1% to 243
- Entry threshold began at $645,000
Luxury Single Family:
- Median sales price declined 4.8% to $1,900,000
- Average sales price rose 1.8% to $2,605,203
- Days on market was 142 days, down from 165
- Listing discount was 9.6%, up from 9.5%
- Listing inventory declined 25.8% to 419
- Entry threshold began at $1,250,000
Delray Beach
- Most price trend indicators for the overall market by condo and single family moved higher
- The number of sales for condos and single families market wide increased
- Marketing time fell across the overall market
- The negotiability of luxury single family and condos tightened
Key Trend Metrics (Year Over Year)
Luxury Single Family:
- Median sales price surged 12.3% to $1,737,500
- Days on market was 148, up from 118
- Listing discount was 8.7%, down from 11%
- Entry threshold began at $1,260,000
Luxury Condo:
- Median sales price declined 10% to $575,750
- Days on market was 80, down from 116
- Listing discount was 5.5%, down from 5.8%
- Entry threshold began at $390,000
Wellington
- Overall market price trend indicators moved higher over both property types
- Listing inventory and sales were up slightly across most segments of the market
- Luxury single family prices and sales size were up sharply
- Smaller luxury condo sales size skewed most price indicators lower
Key Trend Metrics (Year Over Year)
Luxury Condo:
- Median sales price fell 23.2% to $437,500
- Average square footage fell 11.9% to 2,034
- Days on market was 182, up from 160
- Listing discount was 5.9%, unchanged
- Listing inventory rose 8.3% to 52
- Entry threshold began at $350,000
Luxury Single Family:
- Median sales price jumped 34.4% to $2,150,000
- Average square footage rose 17.3% to 4,877
- Days on market was 176, up from 167
- Listing discount was 14.9%, up from 14.4%
- Listing inventory rose 4.3% to 218
- Entry threshold began at $845,000
Palm Beach
- Highest combined number of condo and single family sales in three years
- Listing inventory fell across the market by property type
- Condo price trends declined, skewed by shift to smaller sized sales
- Luxury inventory and days on market expanded
Key Trend Metrics (Year Over Year)
Luxury Condo & Single Family:
- Median sales price declined 20.8% to $12,537,970
- Days on market was 148, down from 140
- Listing discount was 17.7%, up from 15.3%
- Listing inventory rose 30.2% to 69
- Entry threshold began at $6,786,250
Jupiter/ Palm Beach Gardens
Jupiter:
- Single family price trend indicators increased as sales and inventory declined
- Condo price trend indicators rose sharply as sales declined
Palm Beach Gardens:
- Single family price trend indicators were mixed as sales and inventory declined
- Condo price trend indicators for the overall markets continued to rise
Key Trend Metrics (Year Over Year)
Jupiter Single Family:
- Median sales price increased 7.3% to $515,000
- Days on market was 60, down from 69
- Listing discount was 5.2%, down from 6.5%
- Listing inventory declined 8% to 402
Jupiter Condo:
- Median sales price rose 12.9% to $315,000
- Days on market was 65, up from 62
- Listing discount was 4.6%, down from 4.9%
- Listing inventory rose 11.7% to 277
Palm Beach Gardens Single Family:
- Median sales price increased 4.8% to $492,500
- Days on market was 77, down from 86
- Listing discount was 6.9%, down from 7.6%
- Listing inventory declined 2.5% to 516
Palm Beach Gardens Condo:
- Median sales price rose 3% to $242,000
- Days on market was 52, down from 62
- Listing discount was 4.4%, down from 4.6%
- Listing inventory jumped 21% to 236
80-Acre Wellington Equestrian Compound With Development Site Lists For $25 Million
An 80-acre equestrian compound located at 13560 Indian Mound Road in Wellington tied to a Houston oil conglomerate has hit the market for $25 million. It is one of the largest properties for sale in South Florida and includes a grass grand prix field with natural jumps, a 26-stall barn with storage.
An 80-acre equestrian compound located at 13560 Indian Mound Road in Wellington tied to a Houston oil conglomerate has hit the market for $25 million. It is one of the largest properties for sale in South Florida and includes a grass grand prix field with natural jumps, a 26-stall barn with storage, a tack room, office, owners lounge, riders lounge, apartments, a rideable track, and 19 grass turnout paddocks. The property also features an elevated development site where a luxury estate could be built, transforming the property into an ultra-luxury equestrian estate. The owner purchased the property for $2 million in 1989. 13560 Indian Mound Road is listed for $25 million with Marley Overman of the Overman Team at Keyes’ Illustrated Properties.
La Lechuza, A 62-Acre Equestrian Compound in Wellington, Sells for $17.1 Million
La Lechuza, the 62-acre estate which is home to the Lechuza Caracas Polo Team, has sold for $17.1 million. The estate was asking $28,900,000 and the deal was brokered with Tom Baldwin of Equestrian Sotheby's International Realty. The buyer is PBC Polo Properties, LLC., an entity owned by Nate Ward, who is partner and co-founder of Palm Beach Capital.
La Lechuza, the 62-acre estate which is home to the Lechuza Caracas Polo Team, has sold for $17.1 million. The estate was asking $28,900,000 and the deal was brokered with Tom Baldwin of Equestrian Sotheby's International Realty. The buyer is PBC Polo Properties, LLC., an entity owned by Nate Ward, who is partner and co-founder of Palm Beach Capital, a private equity investment firm based in West Palm Beach. The sale was financed with a $14.1 million mortgage from Stifel Bank & Trust. The seller was PF Polo Properties, LLC. an entity owned by Emma Cisneros, who is connected with Venezuelan banker and polo player Victor Vargas. Vargas owns Banco Occiental de Descuento, the 4th largest bank in Venezuela, and the La Lechuza Polo Team.
La Lechuza is located at 4360 South Road in Wellington and features polo and show jumping facilities. The compound features a 2 regulation size Polo fields, 1/4 mile exercise track, 160" x 255" sand ring, 160" x 255" Grand Prix grass ring, 60-stall polo barn, 12-stall show jumping barn, tack rooms, feed rooms, an aquatic horse walker, fitness center, large car collector's garage, owner’s living quarters, nine apartments with a kitchen and a manager’s office. The property last sold for $4.4 million in 2002.
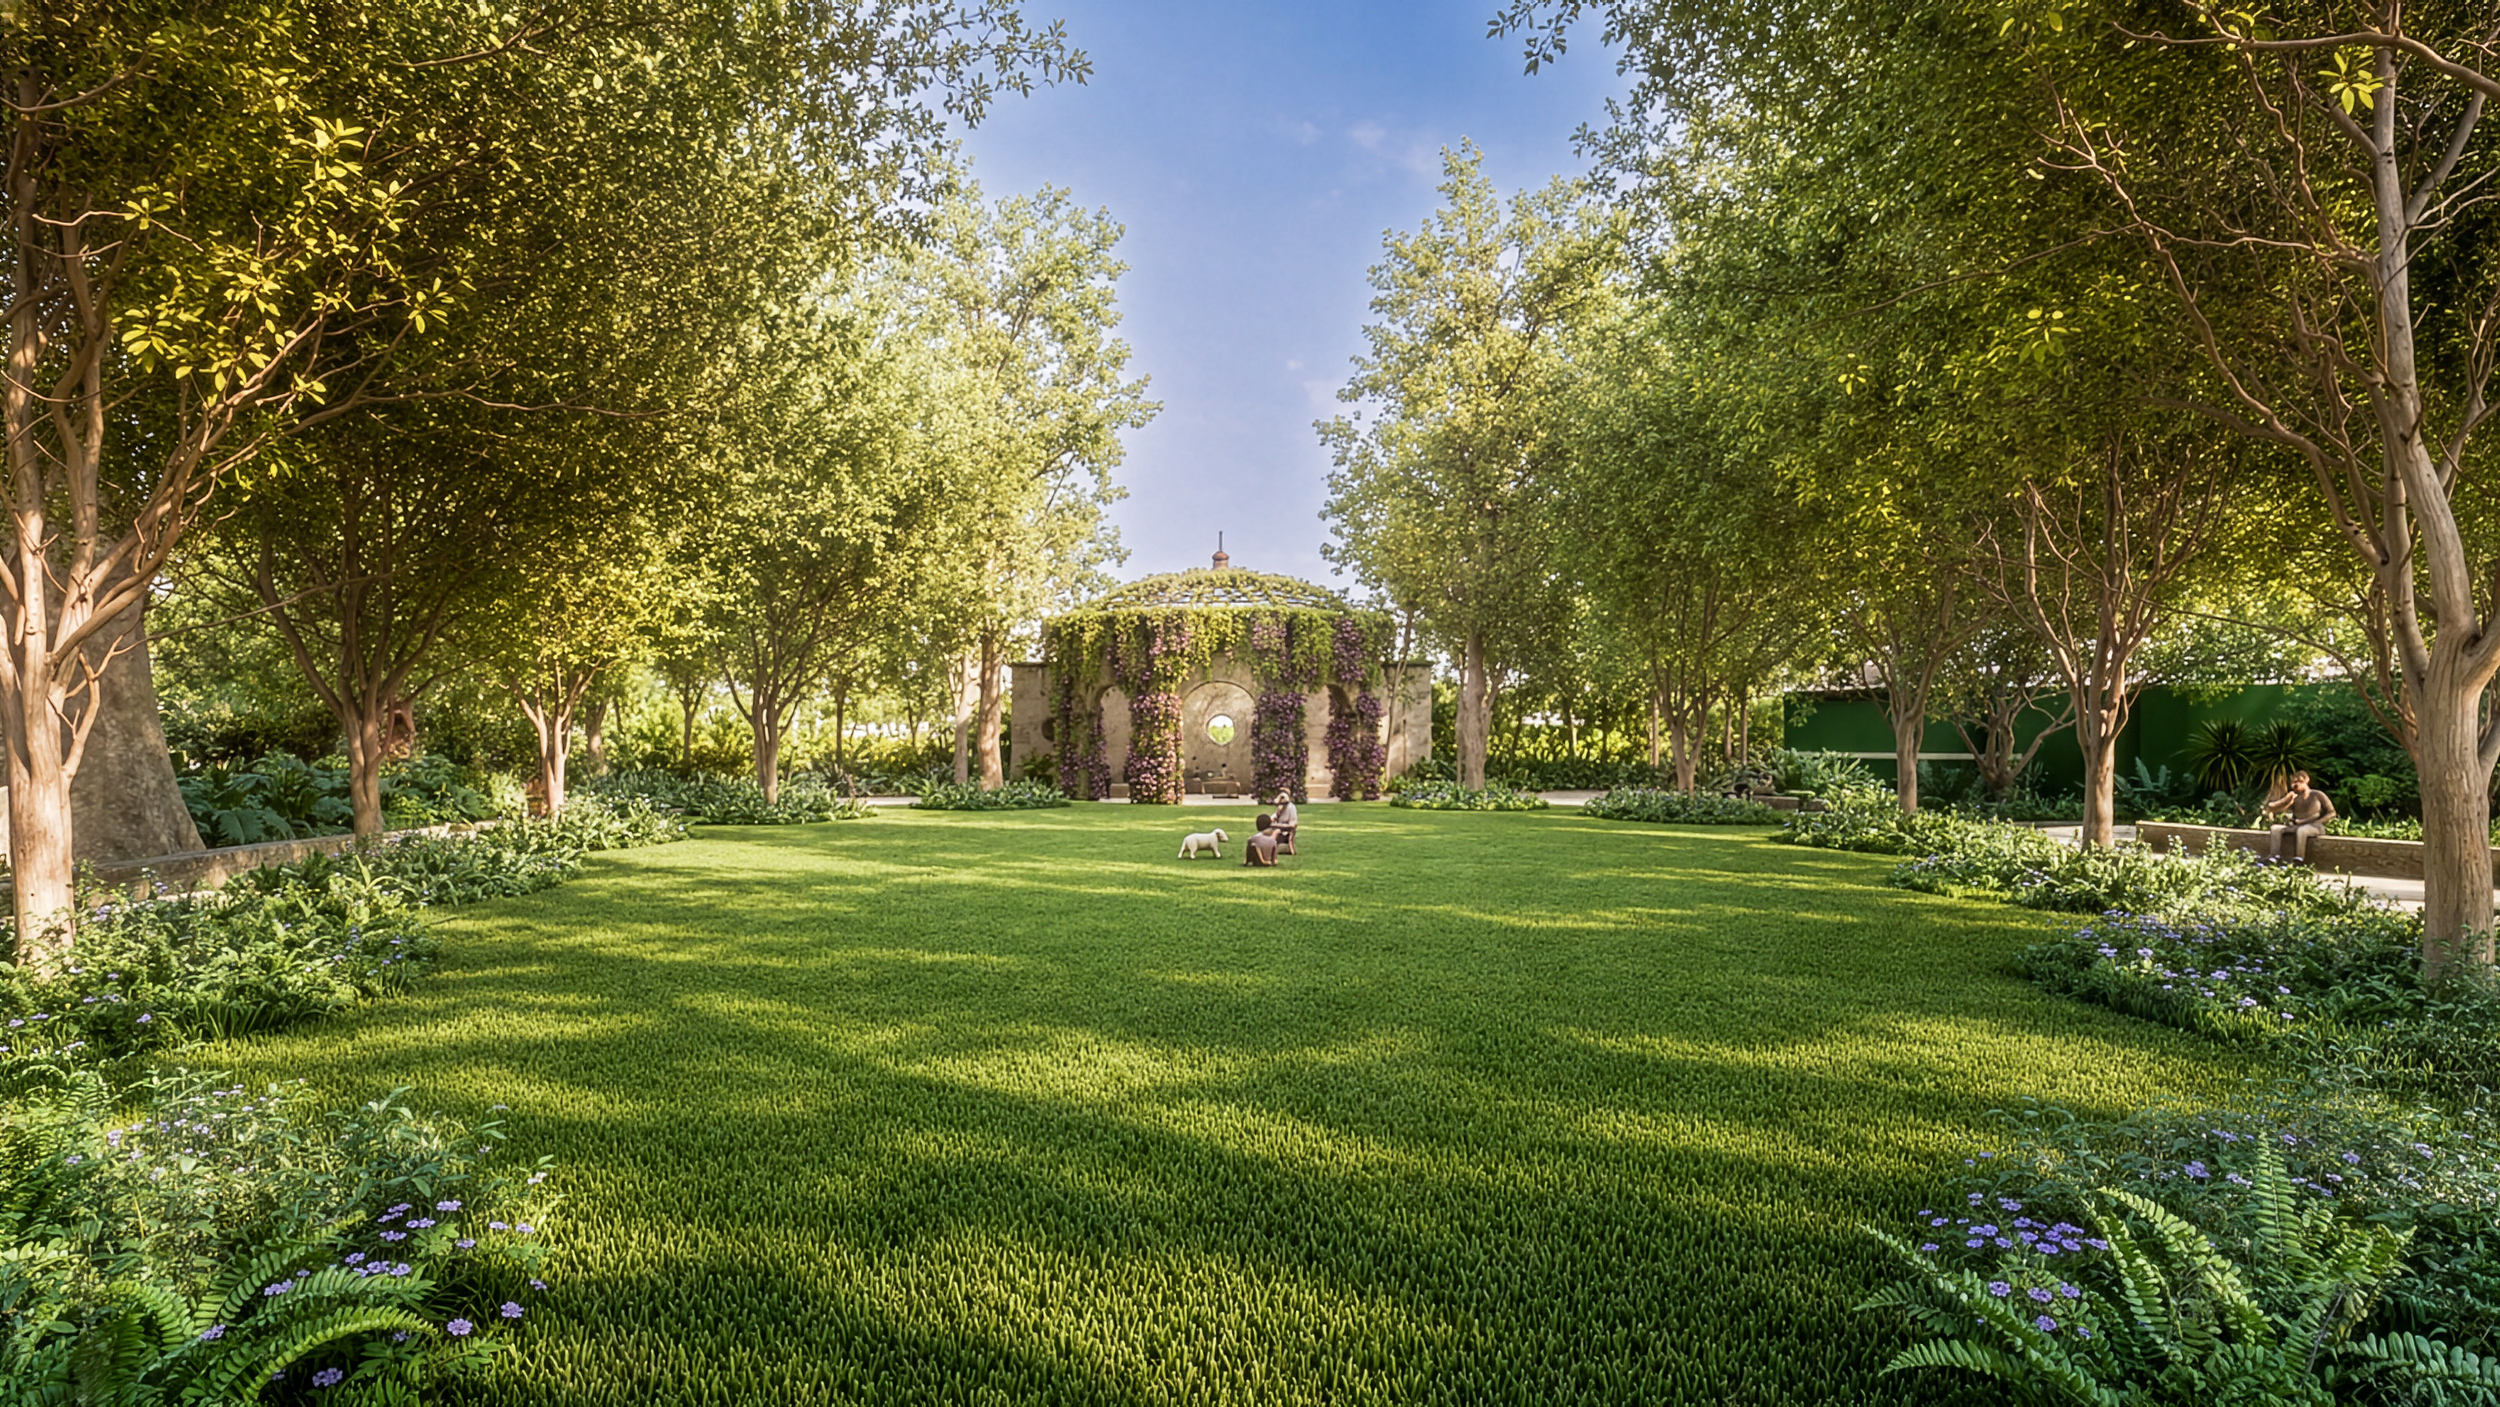
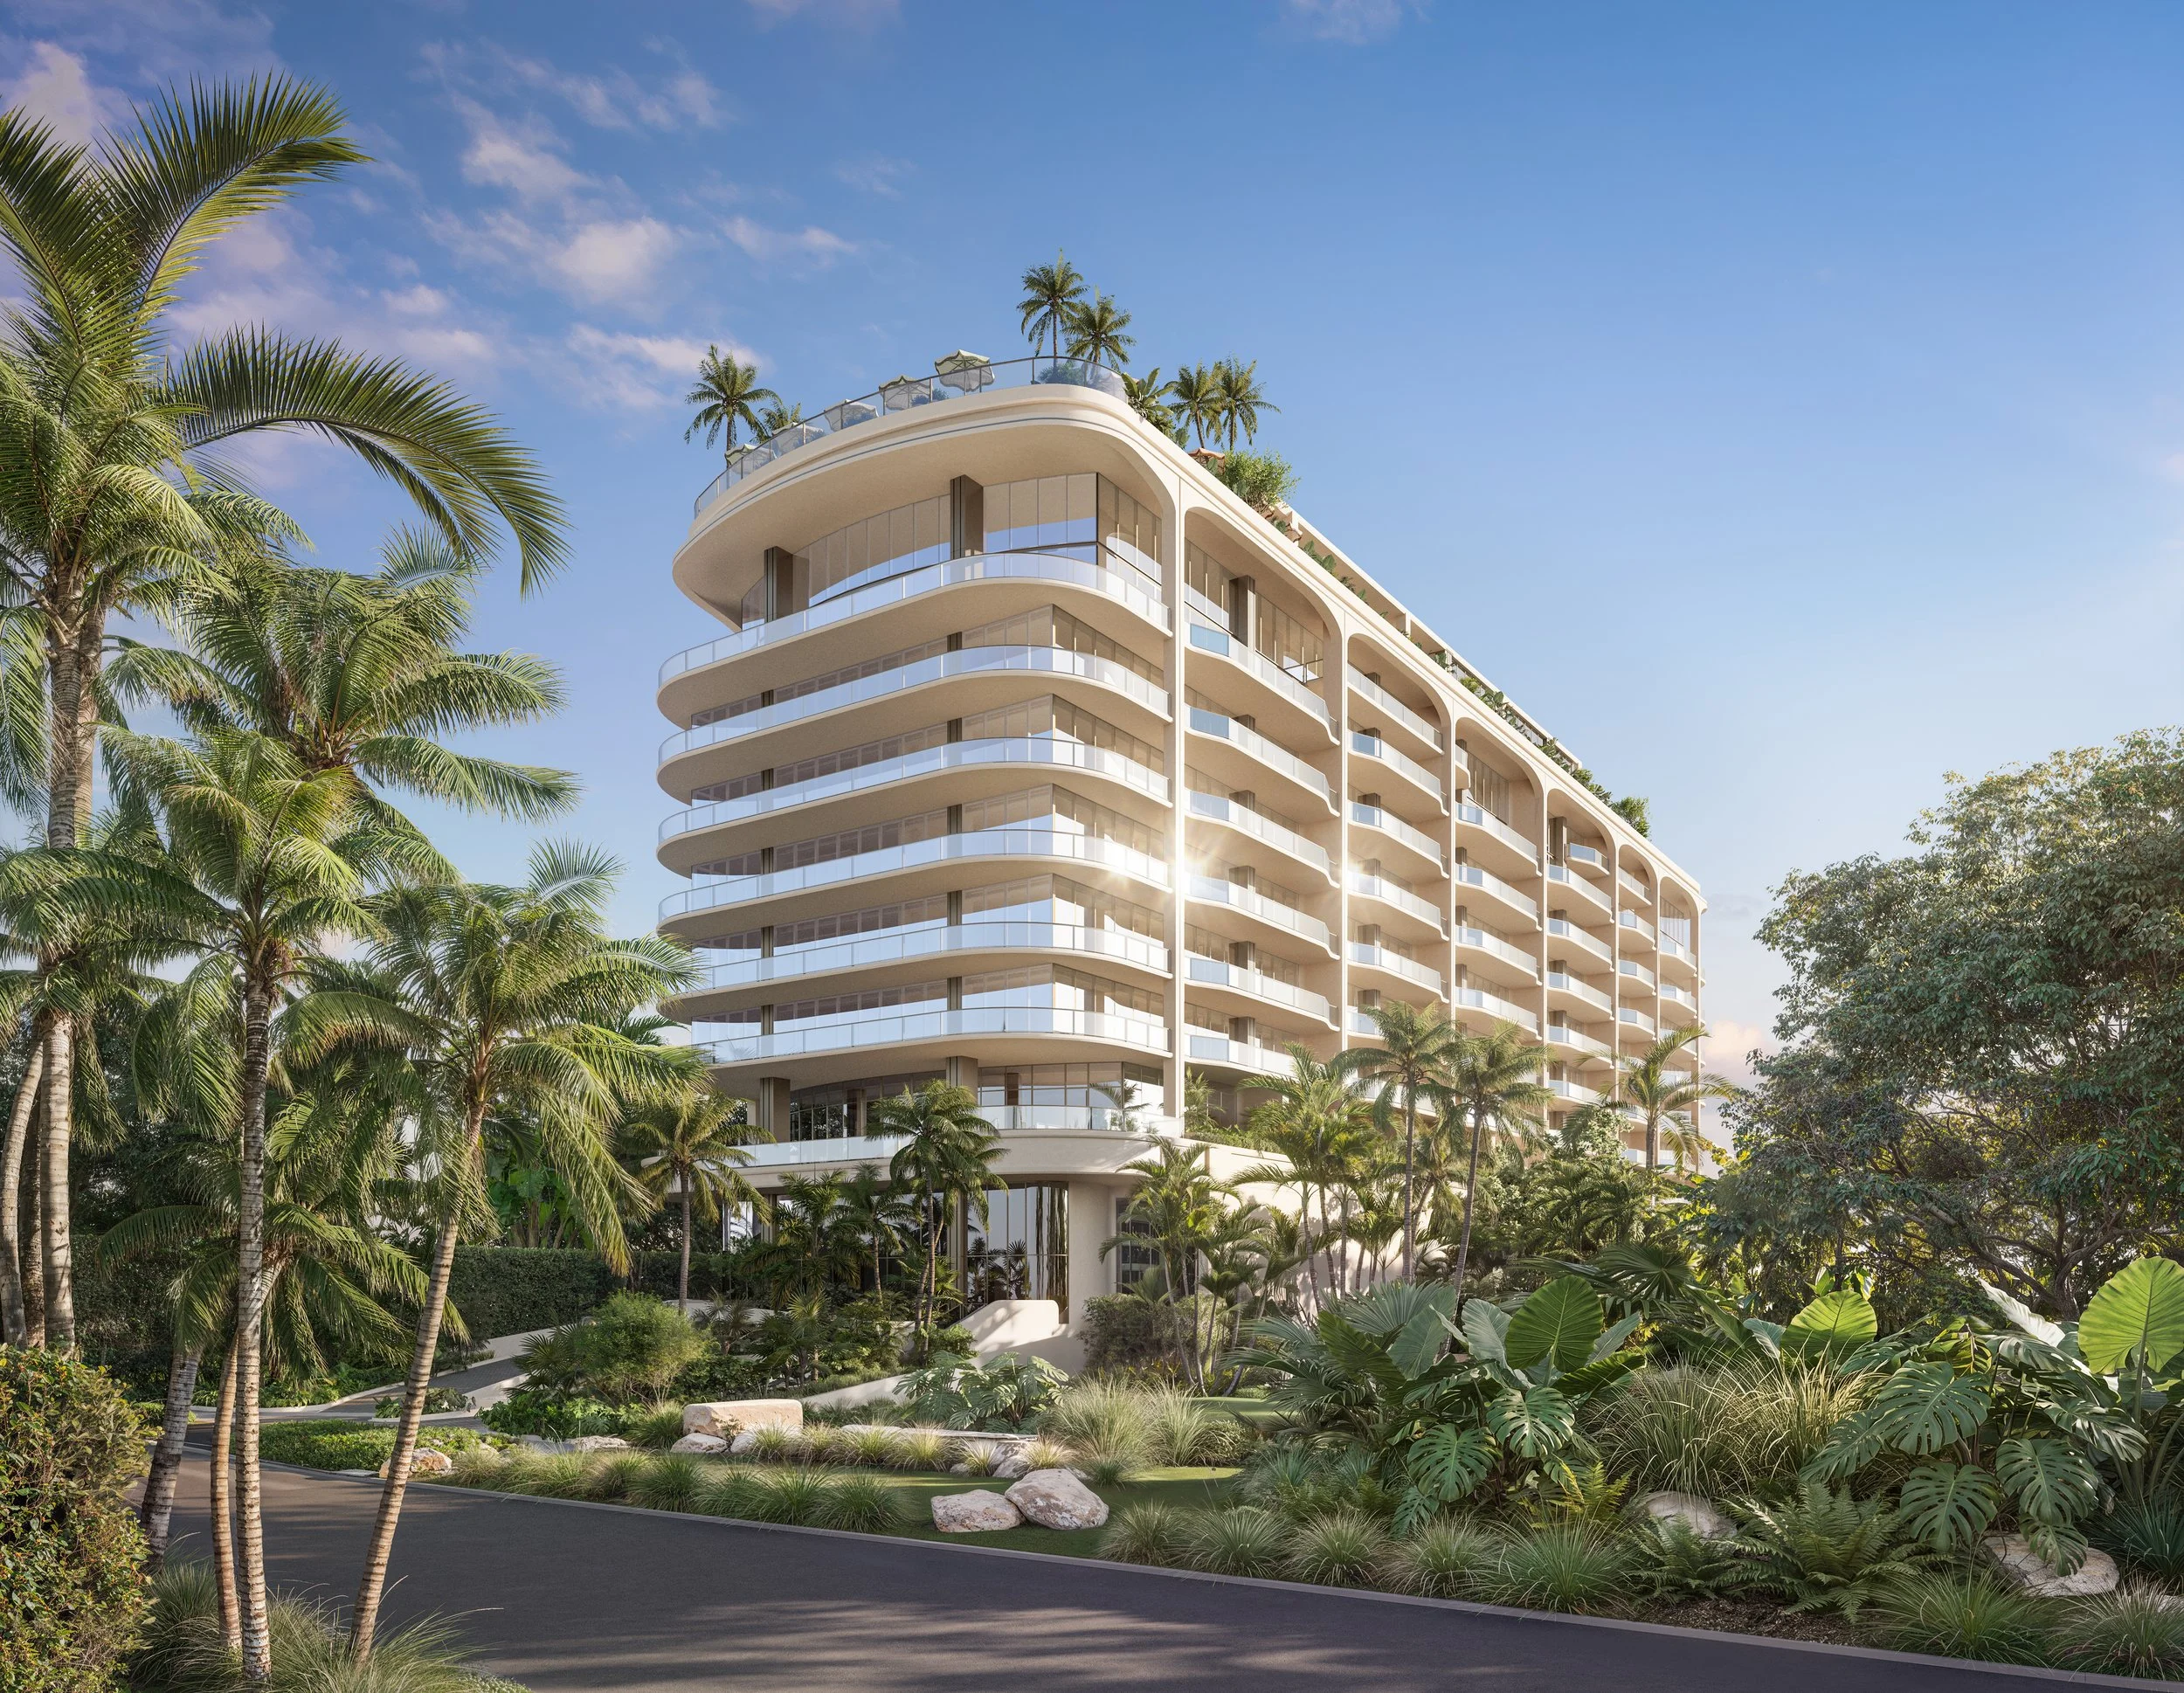
Ytech has unveiled 75 Broadway in Brickell: a 52-story collection of 106 homes from $3 million, designed by KPF with ACPV interiors and Enea landscapes. Completion is anticipated in late 2029.